For the complete documentation index, see llms.txt. This page is also available as Markdown.

Progress Bar

The Avonni Progress Bar component visualizes completion toward a target value, with configurable orientation, style, value display, an optional avatar, and an optional pin indicator.

Overview

Use the Progress Bar to communicate progress at a glance — from simple percentage fields to values computed from multiple Salesforce records via aggregate queries.

Configuration

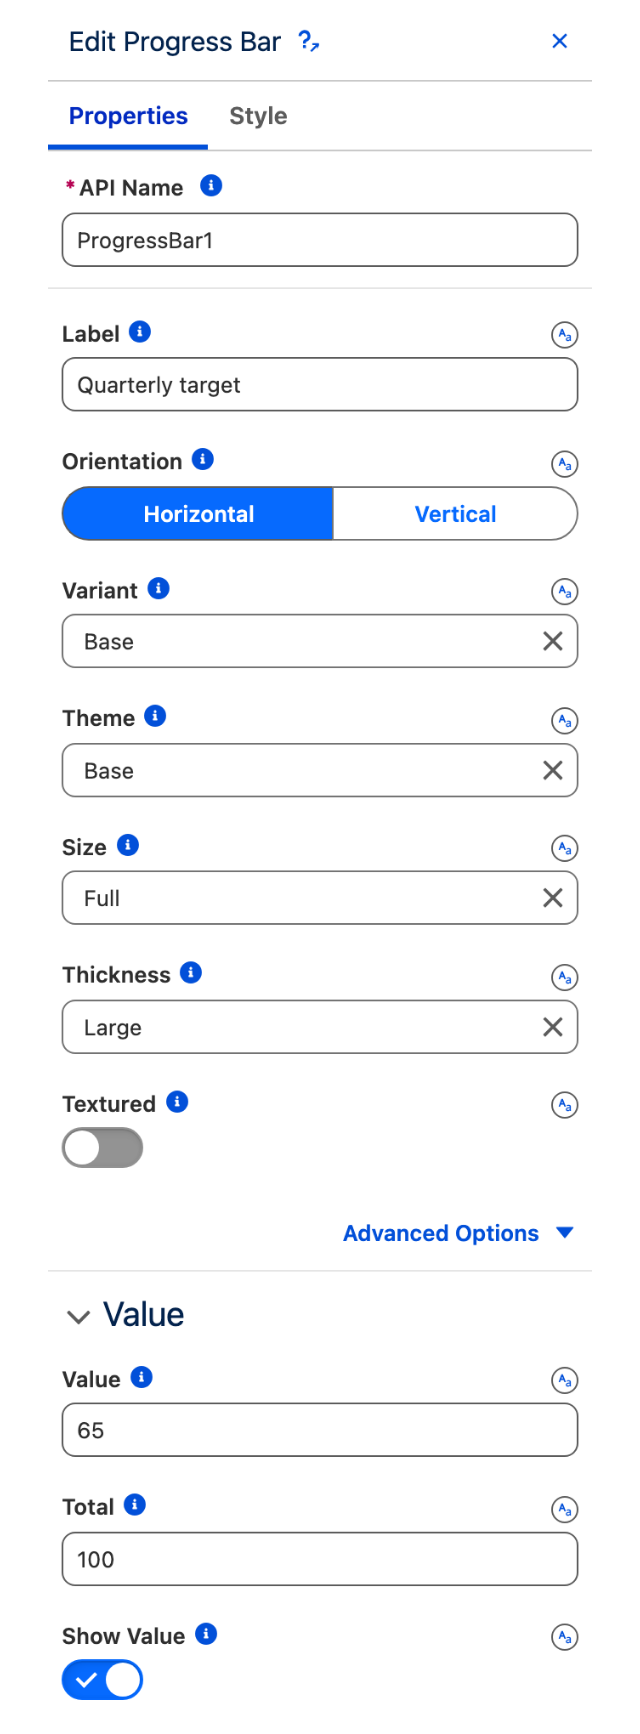
To configure the Progress Bar, select it on the canvas. The configuration panel opens on the right. The sections below mirror its properties from top to bottom.

Appearance

Label

A text label displayed above or alongside the bar to describe what it measures.

Orientation

Controls the direction of the bar. Horizontal (default) draws the bar left-to-right; Vertical draws it bottom-to-top.

Variant

Changes the shape of the bar ends. Base (default) uses straight ends; Rounded uses rounded ends.

Theme

Sets the color theme of the filled portion of the bar. Available themes: Base (default), Success, Inverse, Alt Inverse, Warning, Info, Error, and Offline.

Base VS Circular Variant

Size

Controls the overall width of the bar. Options: X Small, Small, Medium, Large, and Full (default). Full stretches the bar to fill its container.

Thickness

Controls the height (or width, for vertical) of the bar track. Options: X Small, Small, Medium (default), and Large.

Textured

When enabled, applies a texture pattern to the bar background.

Alternative Text

Accessible description of the component, read by screen readers.

Value

Value

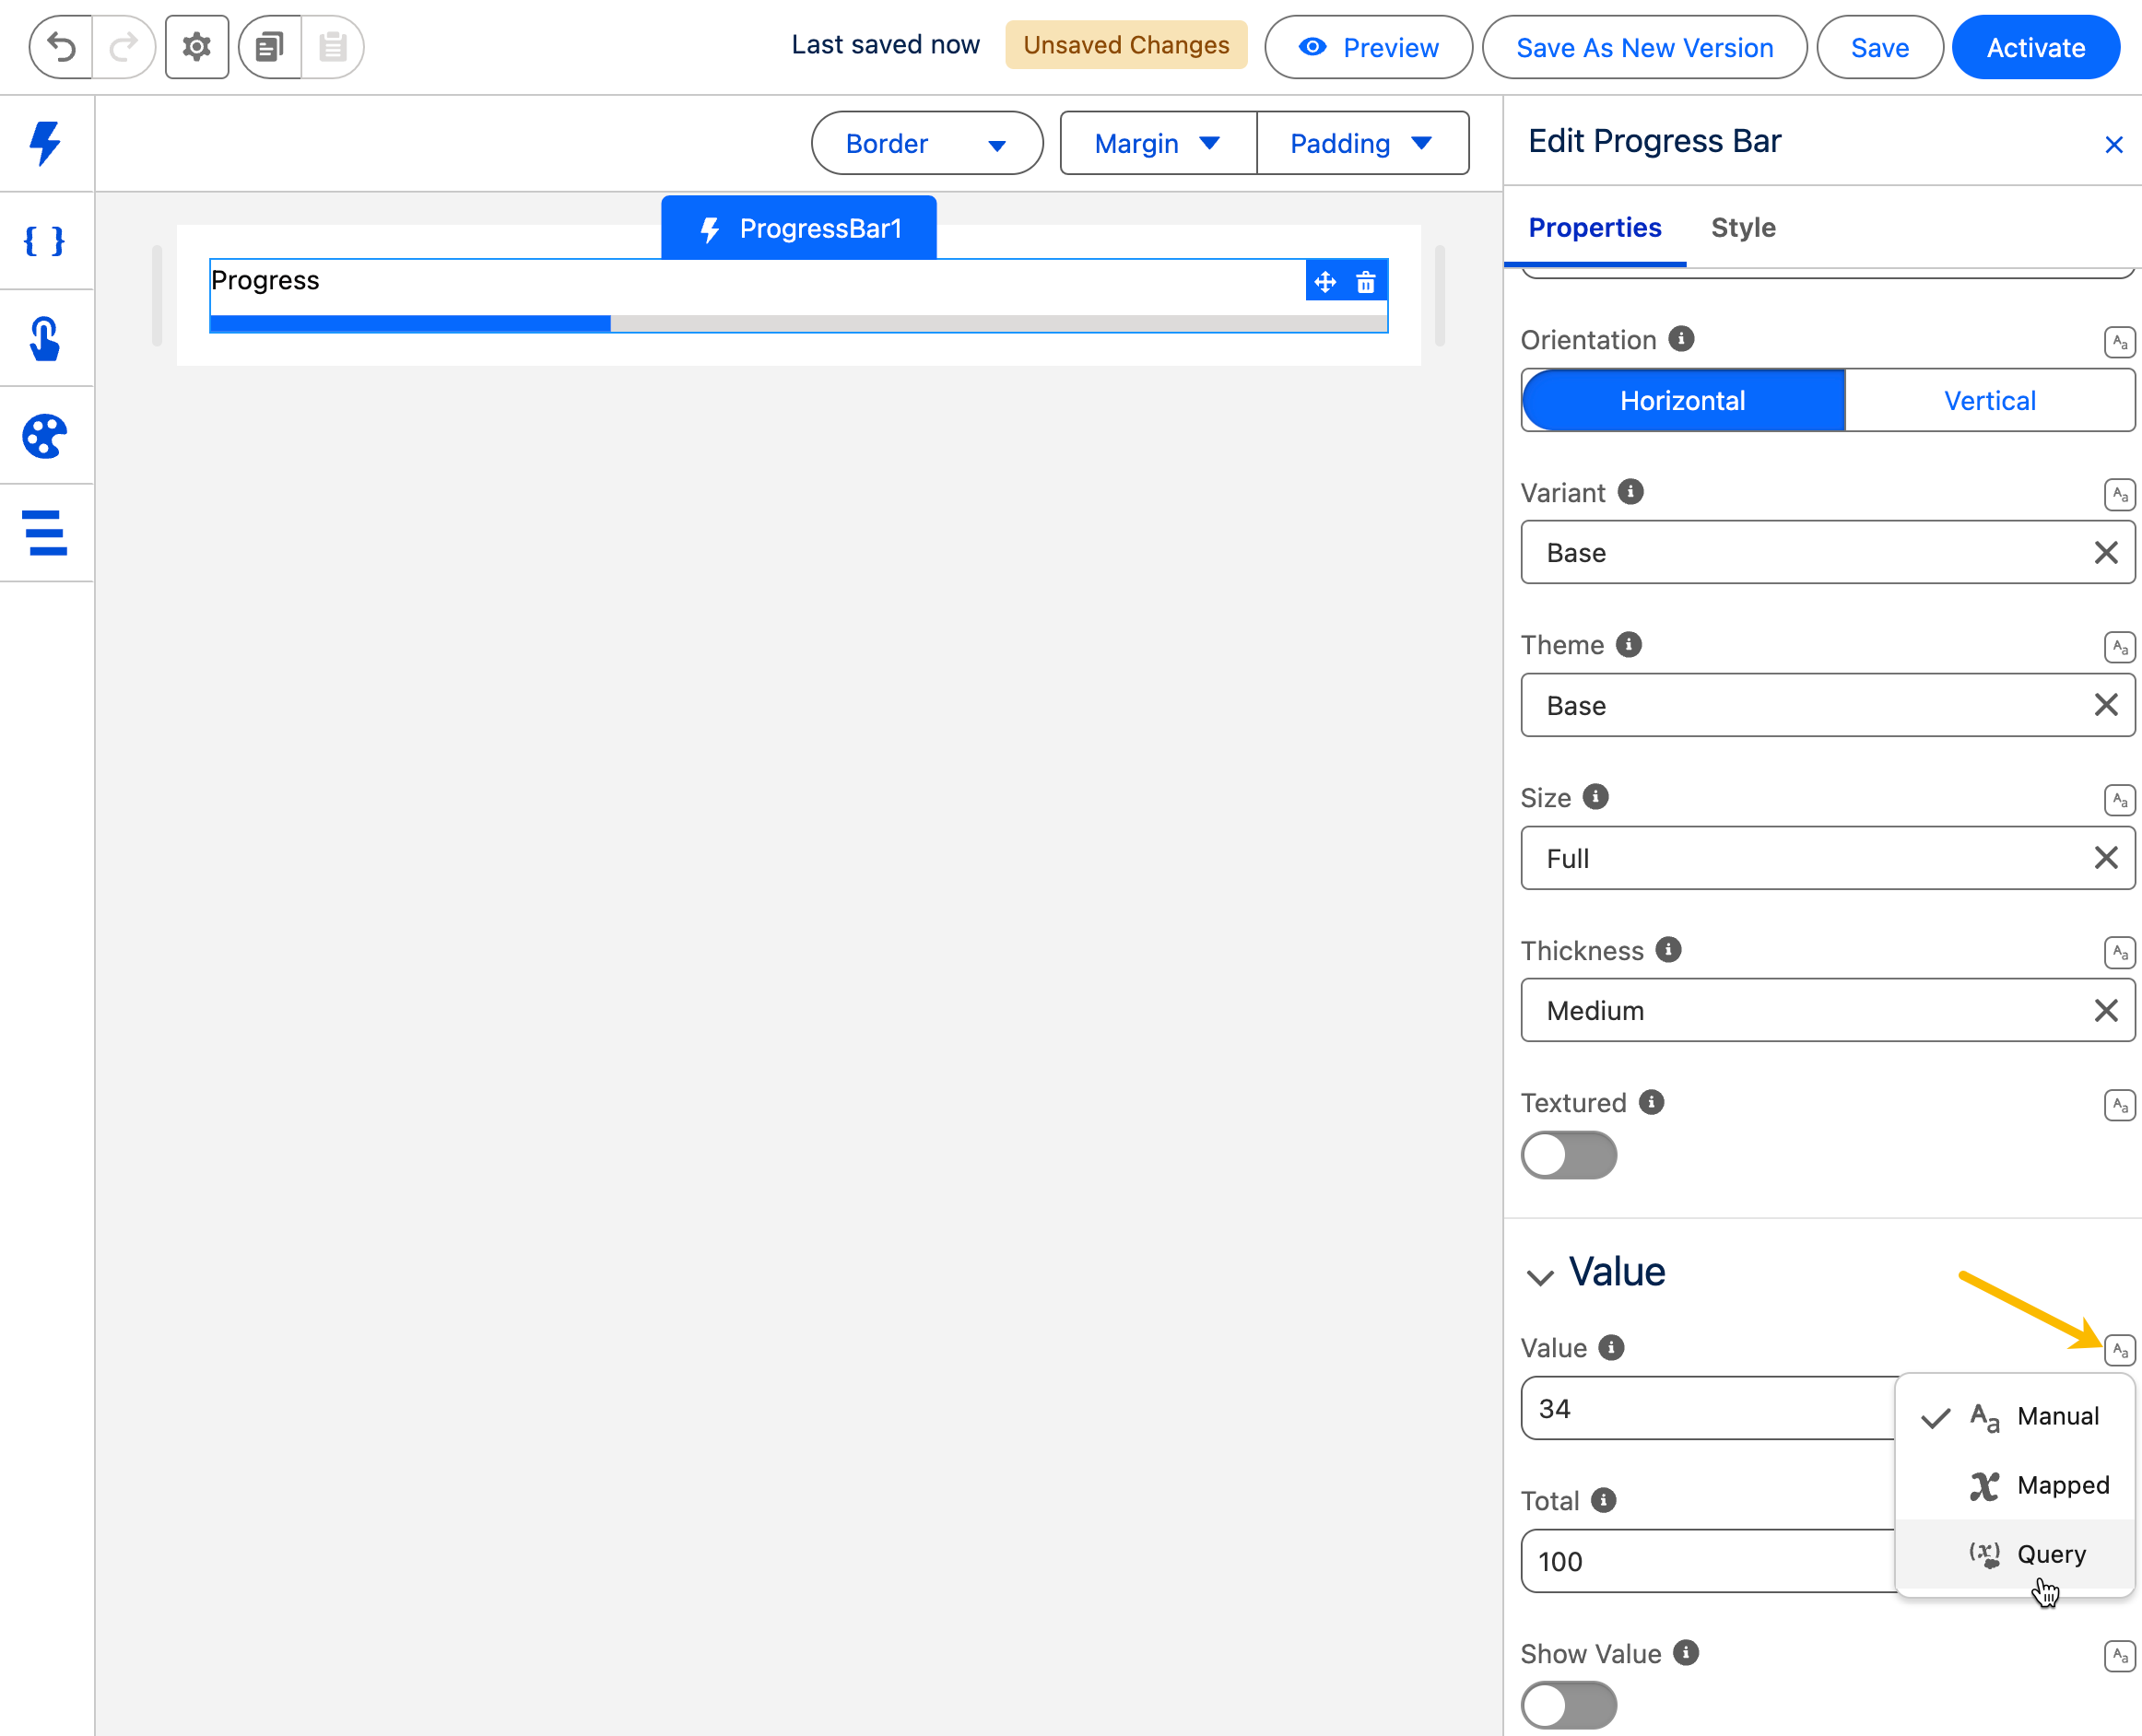
The current progress value. You can set it in three ways:

Option
Description
Best For

Mapped

Link directly to a Salesforce field or a variable.

Simple scenarios where one field represents progress (e.g., a percentage field).

Advanced (Formula)

Define a custom formula combining multiple fields or variables.

Complex calculations or weighted progress across different criteria.

Query

Run an aggregate query (AVG, SUM, MAX, etc.) to calculate the value from multiple records.

Aggregating data across records (e.g., average task completion for a project).

Example scenarios

  • Sales Goal Progress:

    • Mapped: Link the bar to an "Amount Closed" field.

    • Advanced: Calculate progress as "Amount Closed" divided by "Quota."

    • Query: Average the "Percent Complete" of all Opportunities in a specific stage.

  • Customer Satisfaction:

    • Mapped: Display a "Customer Satisfaction Score" field.

    • Advanced: Combine multiple survey response fields into a composite score.

    • Query: Find the average rating across all customer reviews for a product.

Total

The number that represents 100% completion. Defaults to 100. Adjust this when your value field does not already represent a percentage — for example, if your value field tracks "tasks completed" and there are 20 total tasks, set Total to 20.

Show Value

When enabled, the computed percentage is displayed as text next to the bar.

Value Position

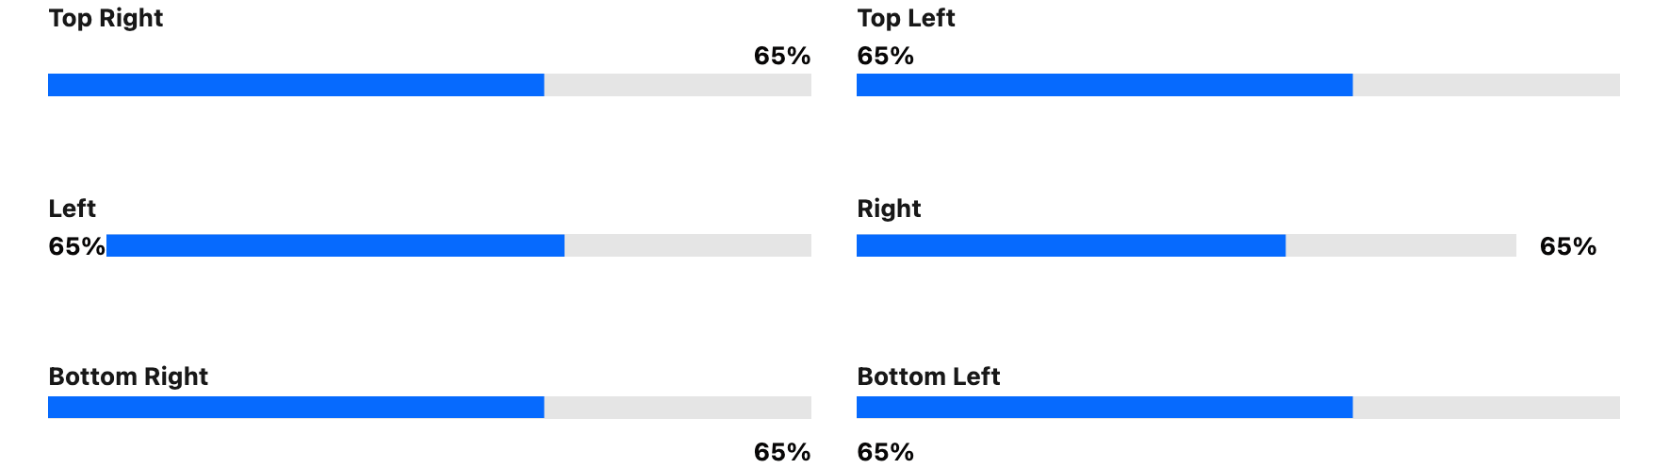
Where the text value appears relative to the bar. Options: Top Right (default), Top Left, Bottom Right, Bottom Left, Left, and Right. Requires Show Value to be enabled.

Value Prefix

Text displayed immediately before the numeric value (e.g., "$"). Requires Show Value to be enabled.

Value Suffix

Text displayed immediately after the numeric value (e.g., "%"). Requires Show Value to be enabled.

Avatar

An optional avatar displayed alongside the bar — useful for associating a person, team, or record with the progress metric.

Setting
Description

Variant

Shape of the avatar: Circle or Square (default).

Initials

Text initials shown when no image or icon is set.

Icon Name

A Lightning Design System icon used as the avatar fallback.

Size

Size of the avatar: X-Small, Small, Medium (default), Large, X-Large, Xx-Large.

Image

URL or uploaded image file to display as the avatar.

Alternative Text

Accessible description of the avatar image.

Position

Where the avatar appears relative to the bar: Left (default) or Right.

Pin

A pin is a marker that appears at the current value position on the bar track.

Show Pin

When enabled, a pin indicator is shown at the current progress position.

Type

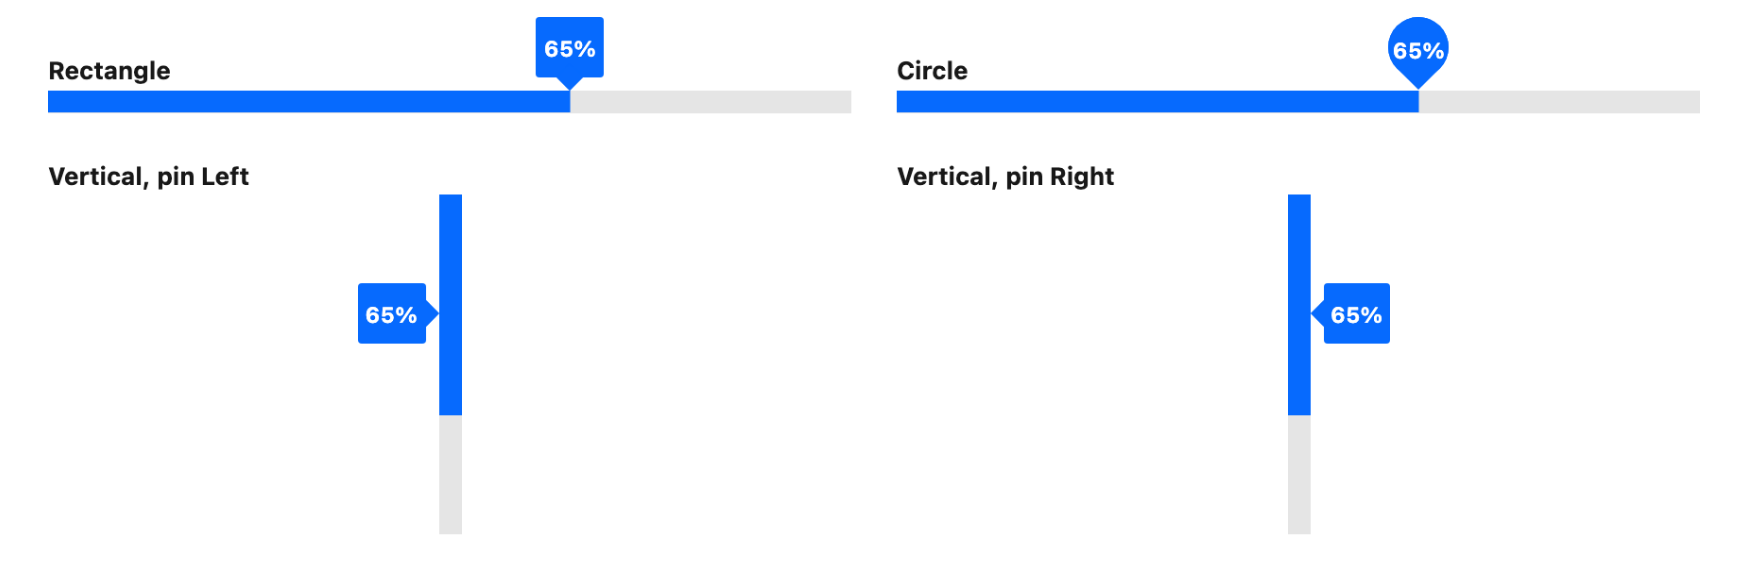
Shape of the pin: Rectangle (default) or Circle. Requires Show Pin to be enabled.

Position

Side of the vertical bar where the pin label appears: Left or Right (default). Only applies when Orientation is set to Vertical. Requires Show Pin to be enabled.

Set Component Visibility

All components support conditional visibility — see Component Visibility.

Styling

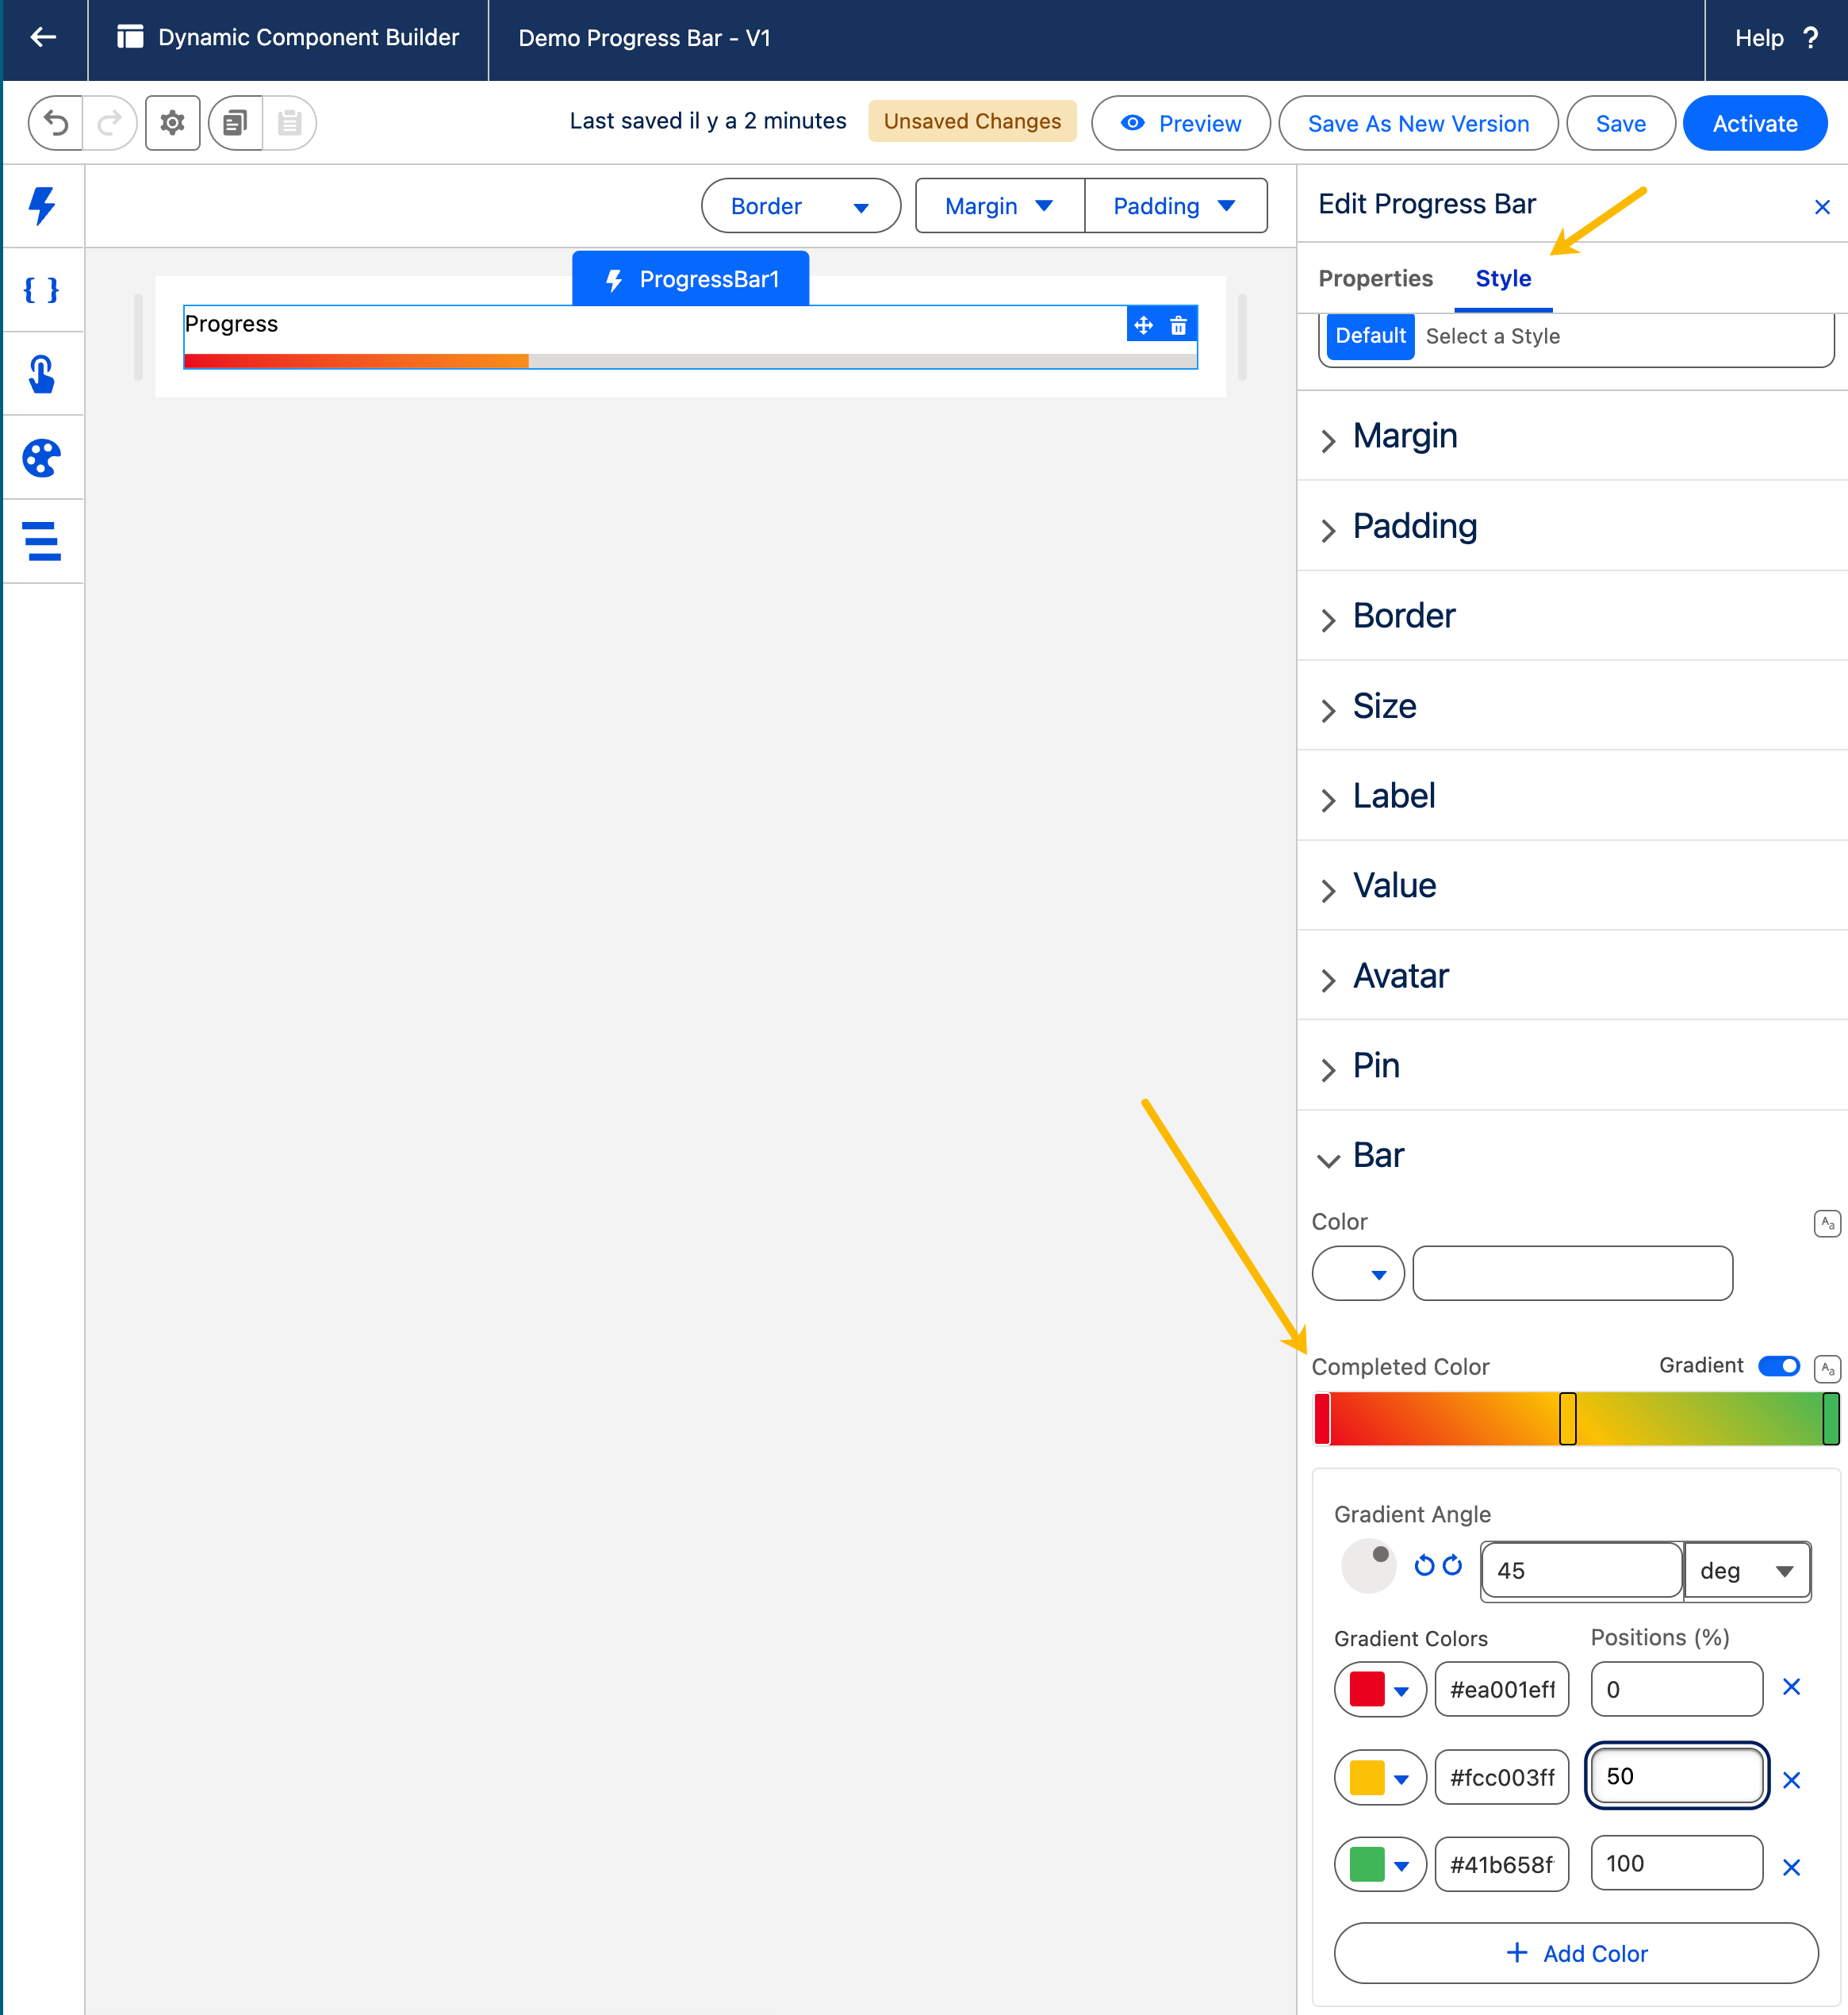
The Style tab lets you tailor the progress bar's appearance. Configure it from the Style tab of the Edit Progress Bar panel.

Controls the outer spacing around the progress bar, creating space between it and other elements.

  • Top / Right / Bottom / Left: Adjust the space on each side.

Output Variables

The Progress Bar exposes an output variable you can reference elsewhere on the page after the component renders.

Others

Output variable
Type
What it returns

Percentage

Number

The current value of the progress bar expressed as a number between 0 and 100.

Example: After loading a record, use Percentage in a conditional-visibility rule on a badge component to show a "Complete" badge only when the value reaches 100.

Last updated

Was this helpful?