> For the complete documentation index, see [llms.txt](https://docs.avonnicomponents.com/llms.txt). Markdown versions of documentation pages are available by appending `.md` to page URLs; this page is available as [Markdown](https://docs.avonnicomponents.com/projects/use-cases/site-survey-inside-a-flow.md).

# Site survey inside a flow

## Overview

A technician traces the roof on a live map, in step 2 of a screen flow, and the shape is saved as a file on the work order. The whole step is one **Map** component from Avonni Flow Screen Components, in Leaflet mode with the drawing tools turned on and the drawing saved as a Salesforce File. This tutorial rebuilds the **Roof outline** screen of SolarOps, a solar installer, in your own org.

## What you build

![Avonni Map in step 2 of a Salesforce screen flow: a roof outline drawn as a polygon on OpenStreetMap tiles, with drawing tools and a Save survey button](https://3857391697-files.gitbook.io/~/files/v0/b/gitbook-x-prod.appspot.com/o/spaces%2FdHOej9Pd5IxJNGEJMZKW%2Fuploads%2FiNkILaoCH7N5PSWIVTL5%2Fuc-02-site-survey-flow.png?alt=media)

* SolarOps runs site surveys as a four step screen flow. Step 2 is the map, titled **Roof outline**, with the caption **Draw the perimeter to estimate panel coverage**.
* The map opens on 2417 Wooldridge Drive, Austin, at zoom level 19, on OpenStreetMap tiles. No Google Maps key is involved.
* The technician draws the roof perimeter with the **Polygon** tool, reshapes it with **Edit**, removes it with **Delete**. Those three tools sit at the top right of the map.
* **Save survey**, at the top left of the map, files the drawing on the work order as a Salesforce File. **Previous** and **Next** are the standard flow footer.

## Before you start

{% hint style="info" %}
**Adapt this to your own org.** This tutorial saves the drawing on the standard **Work Order** object, which exists only in orgs where Work Orders are turned on. Any object with an address does the same job: the map needs a latitude and a longitude to center on, and the save needs the Id of a record to attach the file to. Point the Get Records element at your object, and pass its Id into `{!recordId}`.
{% endhint %}

* The [Avonni Flow Screen Components](https://appexchange.salesforce.com/appxListingDetail?listingId=a0N4V00000IDsfbUAD) package is installed, and your technicians hold a license and the permission set. See [Installation & Licenses management](https://docs.avonnicomponents.com/flow/getting-started/installation-and-licenses-management).
* `https://tile.openstreetmap.org` is listed in **Setup > Trusted URLs**. Leaflet loads its tiles from there; without the entry, the map is a gray rectangle.
* A work order for the property. The figure uses the standard **Work Order** object. A custom object with an address and coordinates works the same way.

| Object                   | Field                     | Type                             | Role                                                                                       |
| ------------------------ | ------------------------- | -------------------------------- | ------------------------------------------------------------------------------------------ |
| Work Order (`WorkOrder`) | `Subject`                 | Text                             | `Solar installation, 2417 Wooldridge Drive`                                                |
|                          | `Street`, `City`, `State` | Address                          | `2417 Wooldridge Drive`, `Austin`, `TX`                                                    |
|                          | `Latitude`, `Longitude`   | Geolocation, part of the address | `30.291694`, `-97.752696`. Centers the map on the roof.                                    |
|                          | `WorkOrderNumber`         | Auto Number                      | Assigned by Salesforce. The SolarOps team calls this job WO-2417; your number will differ. |

**Sample data.** One work order, the one above. The drawing itself needs no field: it is a Salesforce File linked to the work order when the technician clicks **Save survey**.

**Permissions.** The technician needs Read on Work Order and must be able to create Files: Create on `ContentVersion` and on `ContentDocumentLink`. Authenticated Salesforce users typically have both. Guest users on an Experience site do not, and the save fails for them.

## Build it

{% stepper %}
{% step %}

### Create the flow and its record variable

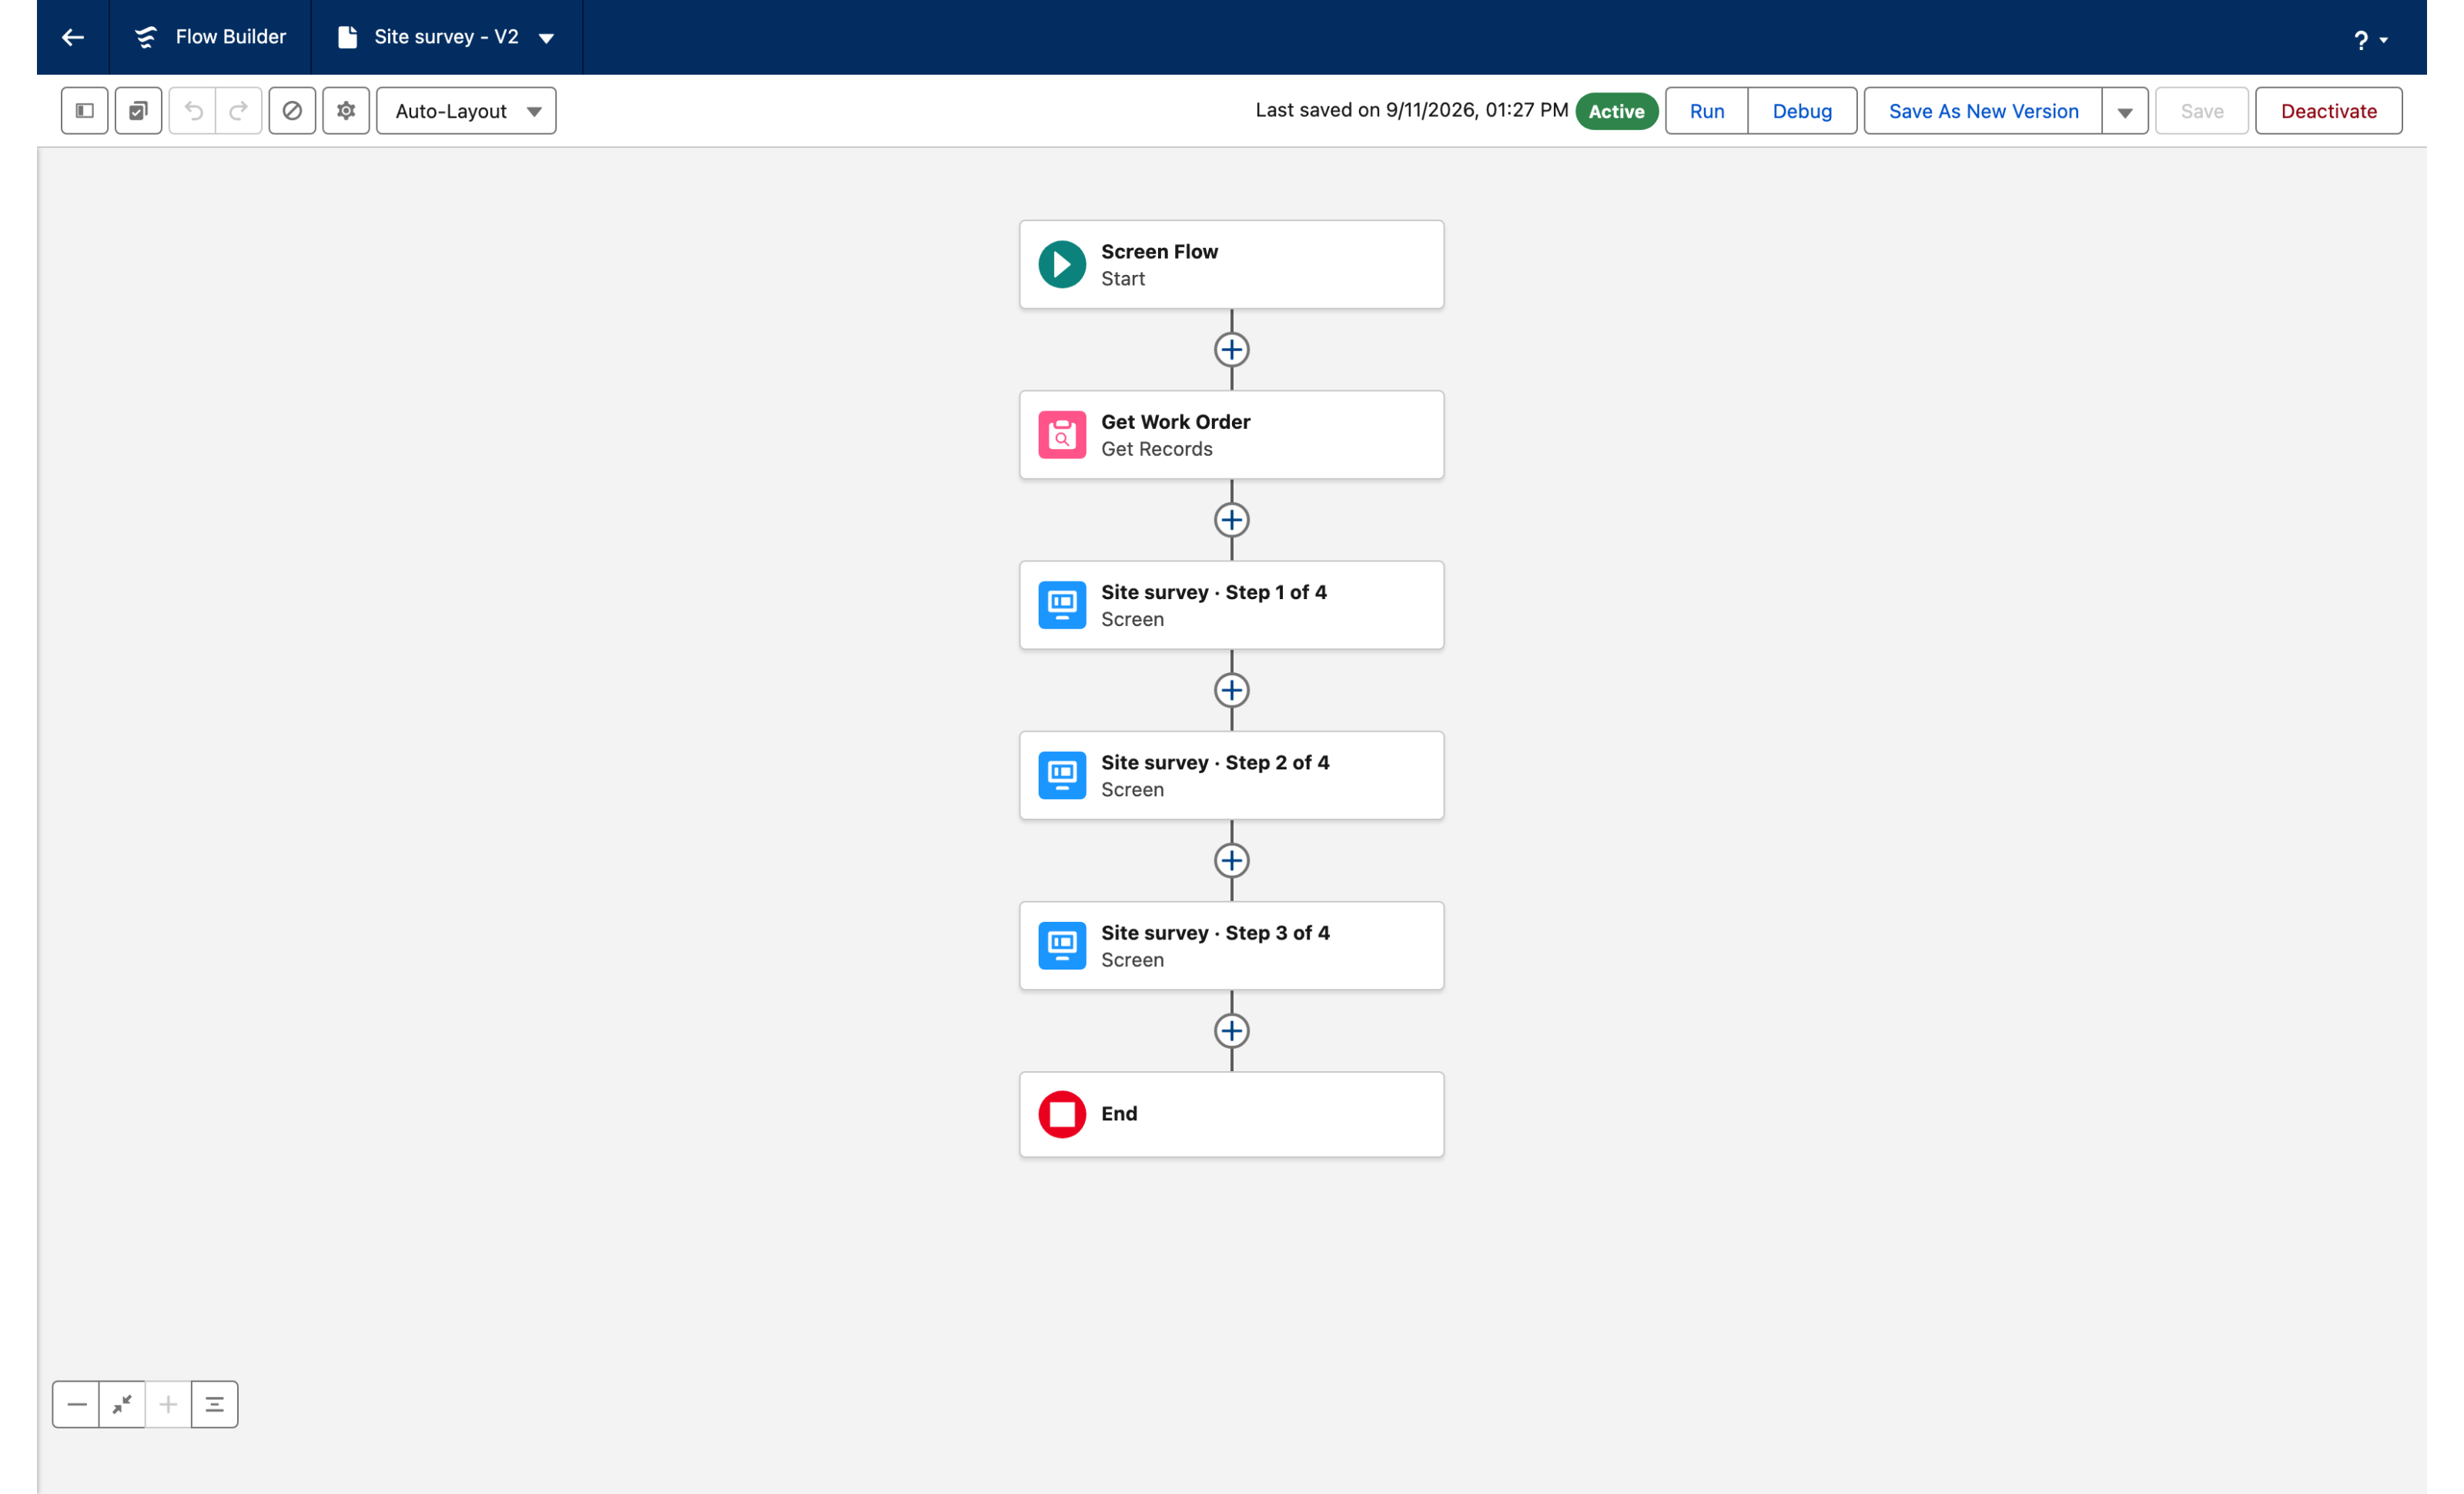
1. In **Setup**, open **Flows** and create a **Screen Flow**.
2. In the **Toolbox**, click **New Resource**: Resource Type **Variable**, API Name `recordId`, Data Type **Text**, **Available for input** checked.
3. Save the flow with the label `Site survey`.

*Why:* the header of a running screen flow shows the flow label, not the screen label. The flow in the figure is labeled `Site survey · Step 2 of 4` so that its header reads that way on the captured screen; in a real flow that text would sit on every screen. Label yours `Site survey` and show the step count in a Display Text or a [Progress Indicator](https://docs.avonnicomponents.com/flow/flow-components/progress-indicator) on each screen. The `recordId` variable receives the work order Id when the flow is launched from the record. See [How to pass your current RecordID in your screen flow](https://docs.avonnicomponents.com/flow/tutorials/tips-and-tricks/how-to-pass-your-current-recordid-in-your-screen-flow).
{% endstep %}

{% step %}

### Read the work order

1. Add a **Get Records** element named `Get Work Order` before the screens: object **Work Order**, condition `Id` **Equals** `{!recordId}`, **Only the first record**.
2. Store all fields, or at least `Subject`, `Latitude` and `Longitude`.

*Why:* the map can be centered on fixed coordinates, which is what the figure does, or on the coordinates of the work order being surveyed. The second option needs the record in a flow resource.
{% endstep %}

{% step %}

### Add the screens

1. Add a **Screen** element labeled `Site survey · Step 1 of 4` with a Display Text: `Confirm the property before drawing the roof.`
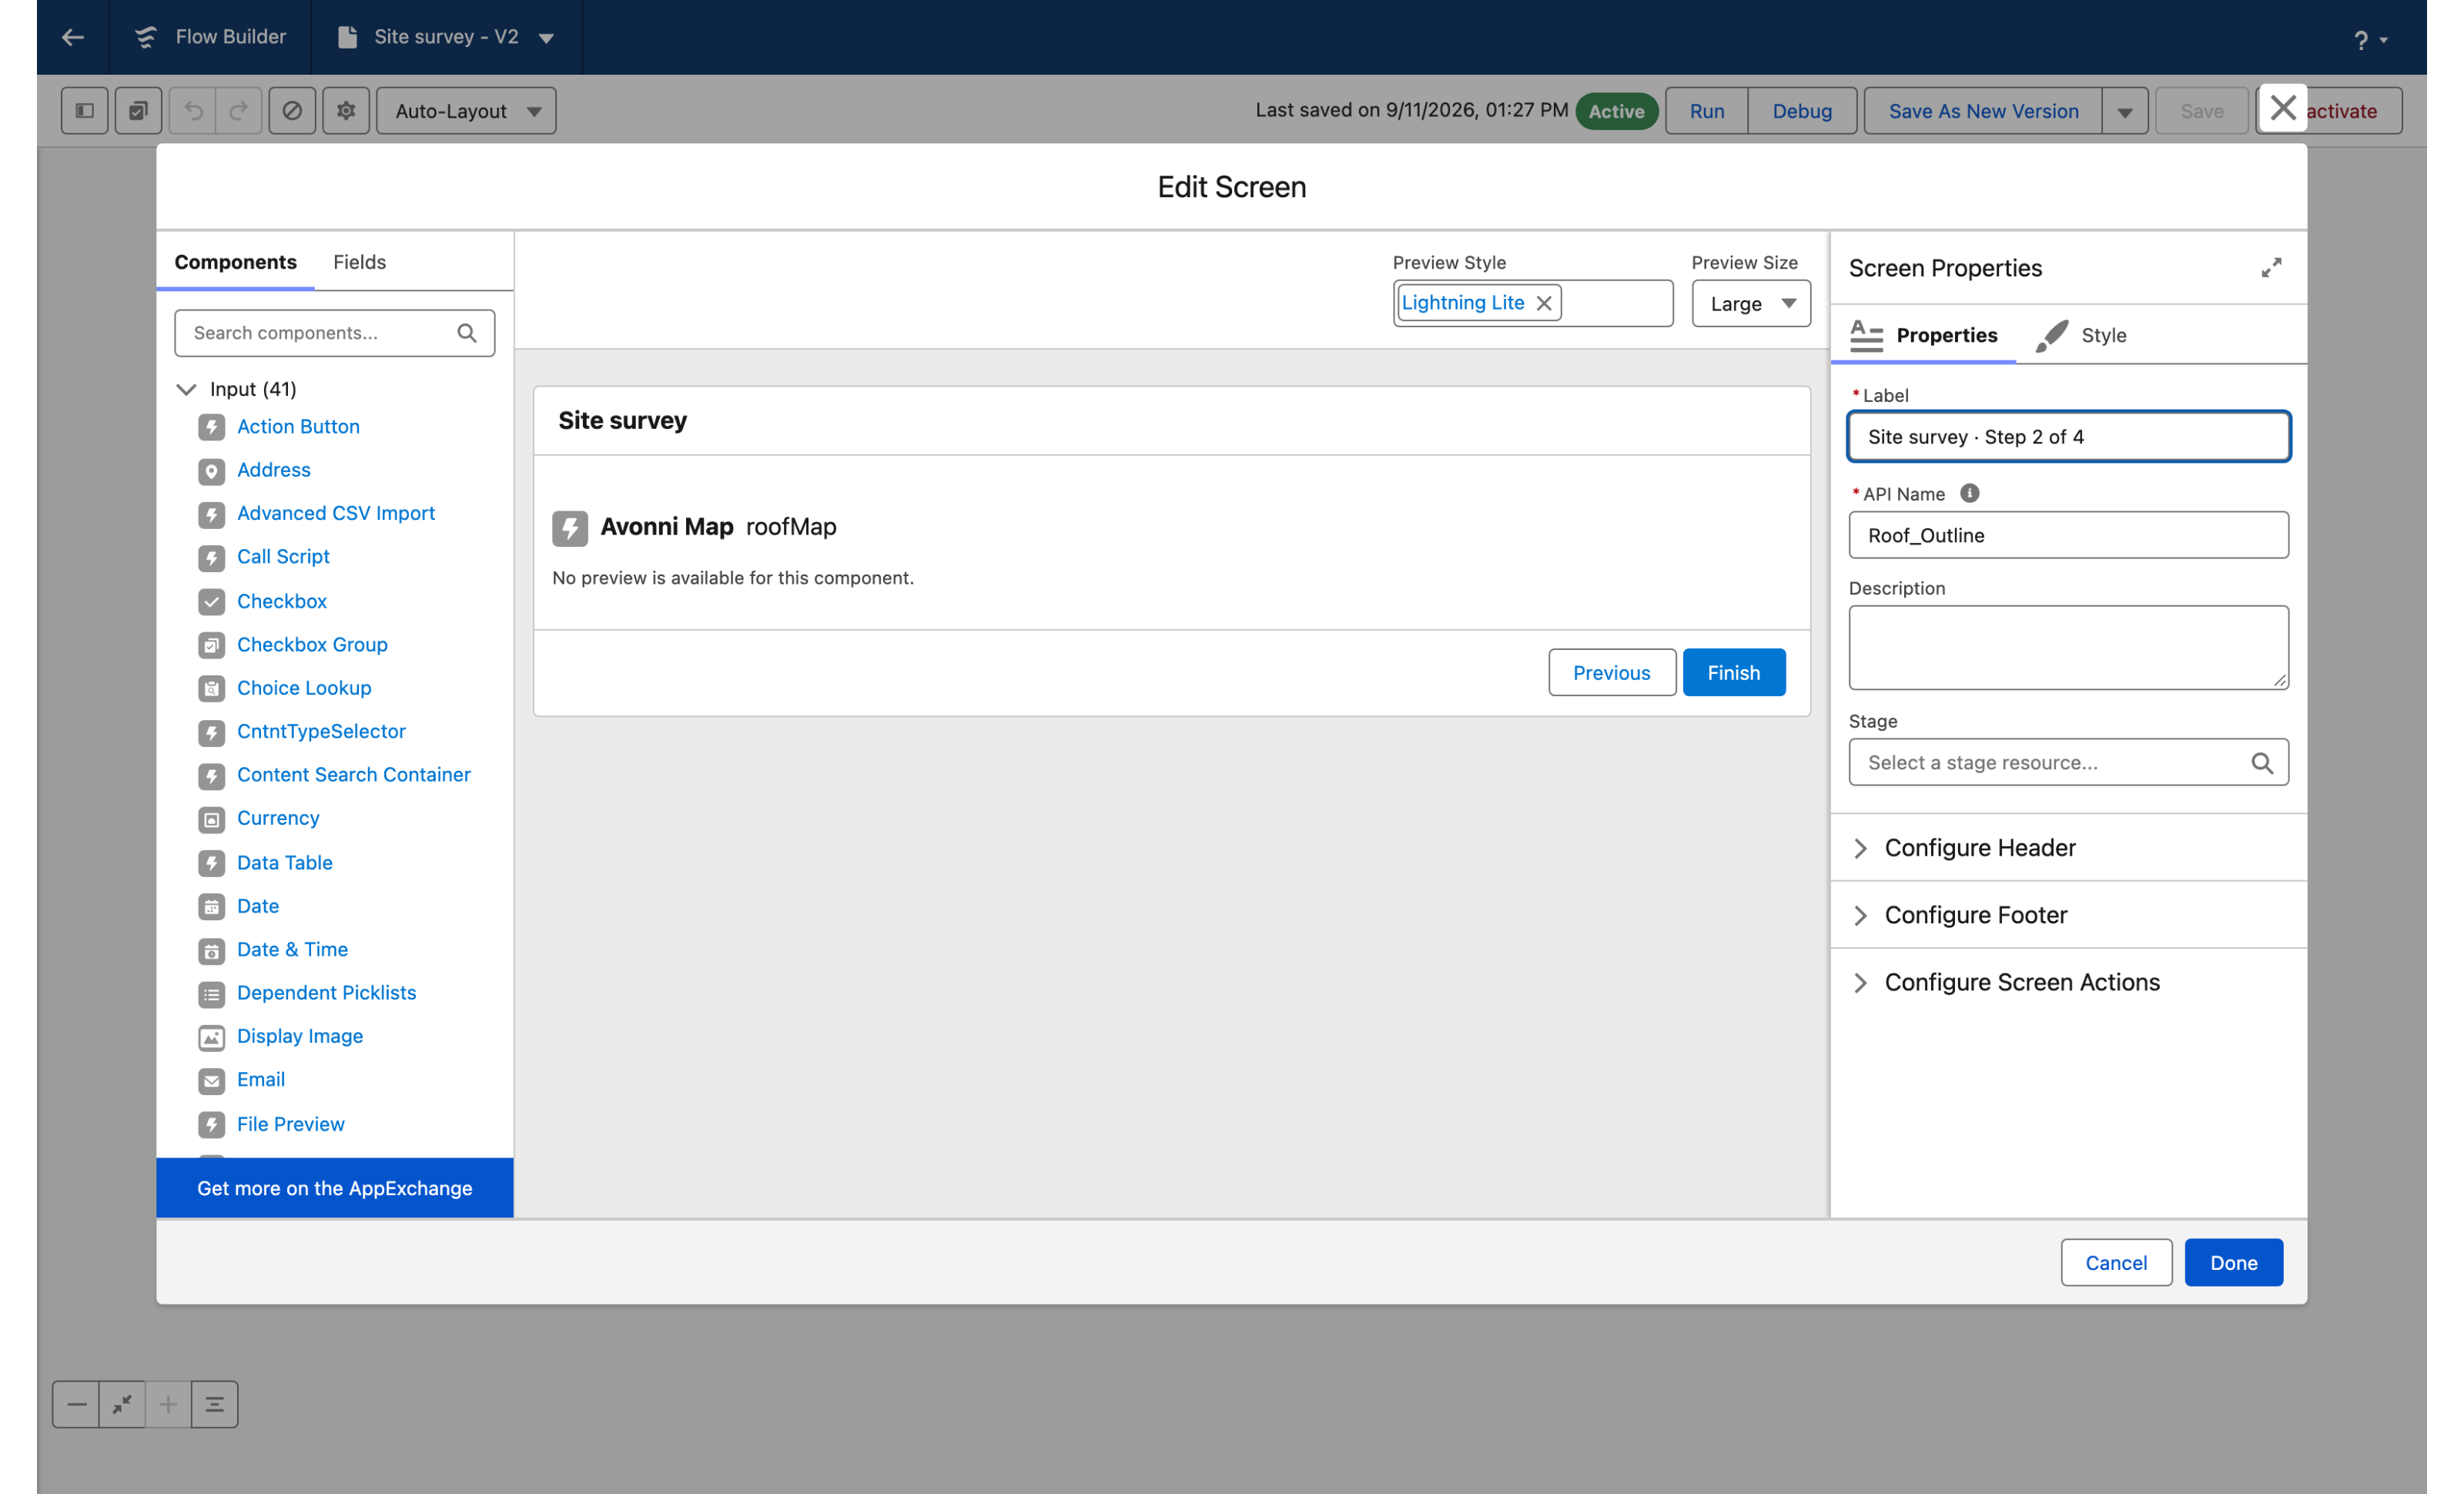
2. Add a second **Screen** element labeled `Site survey · Step 2 of 4`. This is the map screen, the one the rest of this page configures.
3. Add a third **Screen** element labeled `Site survey · Step 3 of 4` with a Display Text: `Review the survey.`
4. Keep the standard header and footer on all three screens.

*Why:* the footer supplies **Previous** and **Next**; the map screen adds nothing of its own for navigation.
{% endstep %}

{% step %}

### Add the Map and pick Leaflet

1. Open the second screen and drag the **Map** component from the Avonni section of the **Components** panel onto the screen.
2. Click the component and open the **Edit Map Component** panel.
3. In the **Properties** tab, set **Map Type** to **Leaflet**.

*Why:* the drawing tools exist on Leaflet only, and Leaflet draws OpenStreetMap tiles without a Google Maps key.
{% endstep %}

{% step %}

### Center the map on the roof

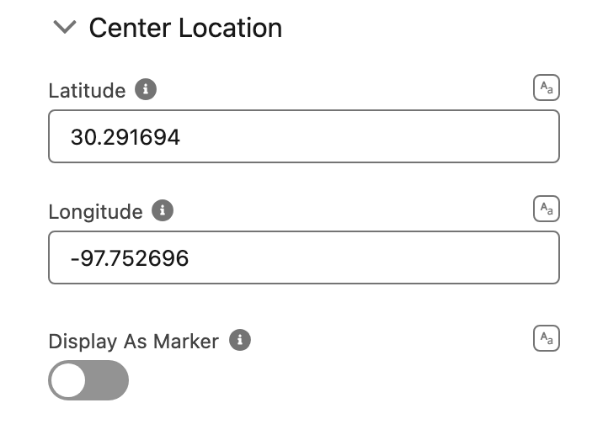
1. Open the **Center Location** section and enter **Latitude** `30.291694` and **Longitude** `-97.752696`.
2. To open every survey on its own roof instead, switch **Latitude** and **Longitude** to **Mapped** and pick `{!Get_Work_Order.Latitude}` and `{!Get_Work_Order.Longitude}`.
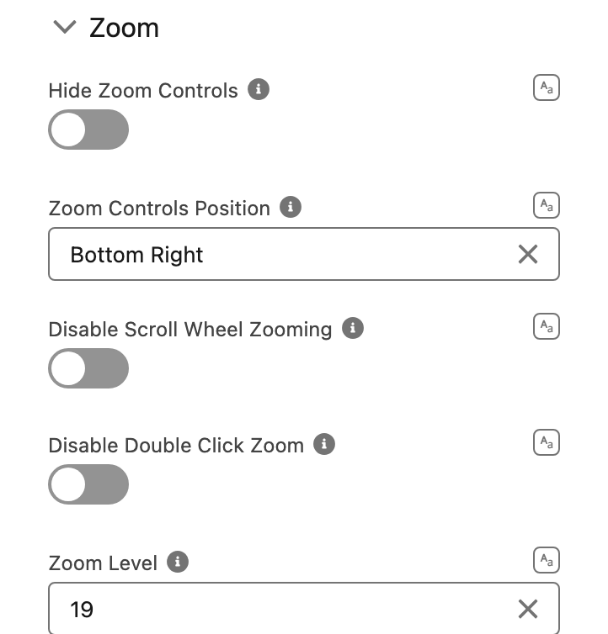
3. Open the **Zoom** section and set **Zoom Level** to `19`.

*Why:* 19 is the deepest zoom level for which OpenStreetMap serves tiles at this address. At 20 the map is an empty gray canvas. At 19 a house is about 130 pixels across, close enough to trace its corners.
{% endstep %}

{% step %}

### Turn on the drawing tools

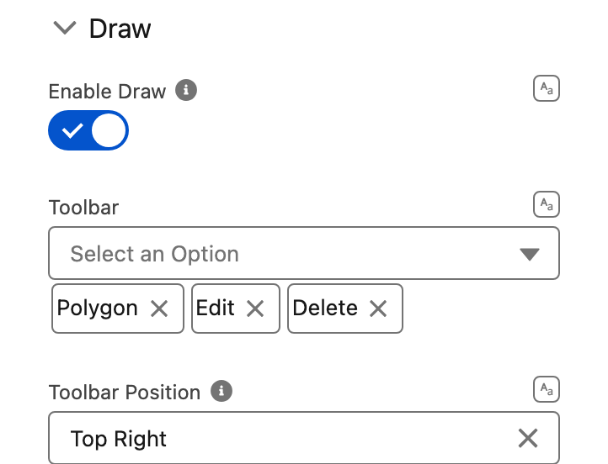
1. Open the **Draw** section and turn on **Enable Draw**.
2. In **Toolbar**, keep **Polygon**, **Edit** and **Delete**. Remove **Line**, **Circle** and **Marker**.
3. Set **Toolbar Position** to **Top Right**.

*Why:* three tools for one job. A roof is a polygon; the other shapes would only invite mistakes. Top right keeps the toolbar clear of the save button, which the component places at the top left of the map.
{% endstep %}

{% step %}

### Save the drawing on the work order

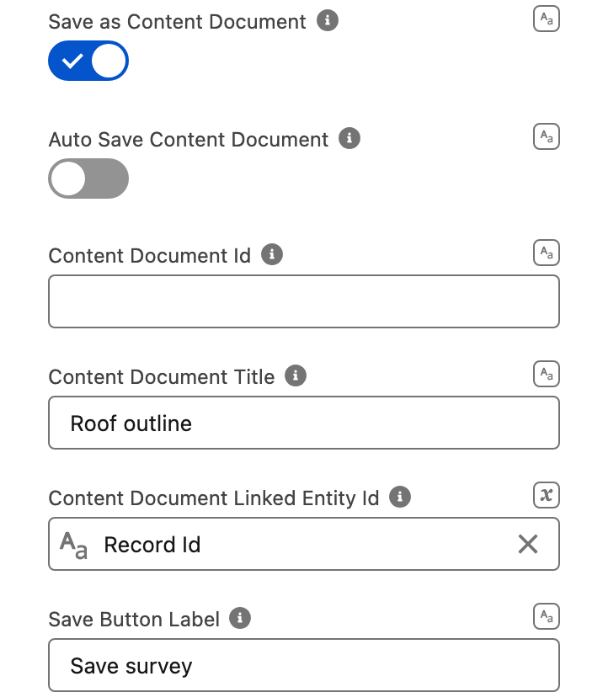
1. Still in the **Draw** section, turn on **Save as Content Document**.
2. Set **Content Document Title** to `Roof outline`.
3. Switch **Content Document Linked Entity Id** to **Mapped** and select `{!recordId}`.
4. Set **Save Button Label** to `Save survey`.
5. Leave **Auto Save Content Document** off.

*Why:* **Content Document Linked Entity Id** is what attaches the file to the record. Without it the file is created in Files and belongs to no work order, so nobody finds it. **Save survey** is the word the crew uses; the default label is `Save`. With auto save off, the technician decides when the outline is final.
{% endstep %}

{% step %}

### Title the map

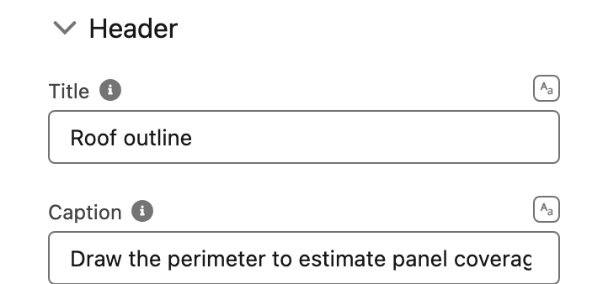
1. Open the **Header** section.
2. Set **Title** to `Roof outline` and **Caption** to `Draw the perimeter to estimate panel coverage`.

*Why:* the map header is the only instruction the technician reads on this screen.
{% endstep %}

{% step %}

### Activate and launch it from the work order

1. Click **Done**, save the flow and click **Activate**.
2. Put the flow where the technicians work. On the Work Order record page, add the standard **Flow** component in **Lightning App Builder**, select `Site survey` and check **Pass record ID into this variable**. A quick action on Work Order works the same way.

*Why:* the figure shows the flow on the **Surveys** tab of the SolarOps app, which is where the crew opens it. Whatever the entry point, `{!recordId}` must be populated, or the file has nothing to attach to.
{% endstep %}
{% endstepper %}

## The settings that matter

| Setting                                                                                                                             | Value                                                  | Why                                                                                                                   |
| ----------------------------------------------------------------------------------------------------------------------------------- | ------------------------------------------------------ | --------------------------------------------------------------------------------------------------------------------- |
| **Map Type** (`type`)                                                                                                               | **Leaflet**                                            | OpenStreetMap tiles, no Google Maps key, and drawing is a Leaflet feature.                                            |
| **Enable Draw** (`drawable`), **Toolbar** (`drawToolsSerialized`), **Toolbar Position** (`drawToolsPosition`)                       | on, **Polygon** / **Edit** / **Delete**, **Top Right** | The tools of the trade and nothing else, out of the way of the save button.                                           |
| **Save as Content Document** (`saveAsContentDocument`) with **Content Document Linked Entity Id** (`contentDocumentLinkedEntityId`) | on, `{!recordId}`                                      | The drawing becomes a Salesforce File on the work order. Without the linked entity, it is a file attached to nothing. |
| **Save Button Label** (`saveAsButtonLabel`)                                                                                         | `Save survey`                                          | The word of the trade instead of `Save`.                                                                              |
| **Zoom Level** (`zoomLevel`)                                                                                                        | `19`                                                   | Close enough to trace a roof, and the deepest level OpenStreetMap serves here.                                        |

## Interactions

| Trigger                  | Action                                                              | What to set                                                                                                                                                                                                                  |
| ------------------------ | ------------------------------------------------------------------- | ---------------------------------------------------------------------------------------------------------------------------------------------------------------------------------------------------------------------------- |
| **Save As Button Click** | Built in: the component creates the file and links it to the record | Nothing. The interaction tab lets you add to it, for example a [Show Toast](https://docs.avonnicomponents.com/flow/component-builder/interactions-panel/show-toast) with a message such as `Survey saved on the work order`. |

## Try it

1. Open a work order and start the flow. Click **Next**: the map opens centered on the roof, at zoom 19. Wait for the tiles to sharpen before drawing.
2. Select the **Polygon** tool, click each corner of the roof, and click the first corner again to close the shape. The outline appears on the map. Select **Edit**, drag a corner, and confirm.
3. Click **Save survey**, then open the work order in another tab: the **Files** related list holds a file named `Roof outline`.

## Take it further

The same map exists on the other Avonni surfaces:

* [Map](https://docs.avonnicomponents.com/dynamic-components/components/map) for Dynamic Components, on a Lightning page, with the same **Enable Draw** and **Save as Content Document** settings.
* [Leaflet Map](https://docs.avonnicomponents.com/lwc-components/data-driven-components/leaflet-map) for LWC Components, as the `avonni-dd-leaflet-map` tag in your own component, with `drawable` and `saveAsContentDocument`.
* [AX - Map](https://docs.avonnicomponents.com/experience-cloud/experience-components/ax-map) for Experience Sites displays maps and markers. Its panel does not offer the drawing tools as of September 2026.

Two variations worth trying:

* Turn on **Auto Save Content Document** to file the outline as soon as it is drawn, with no button to click. The **Save As Button Click** interaction is then no longer available.
* Set **Tile Layer** to a satellite imagery template, such as the Esri World Imagery URL listed on the [Map](https://docs.avonnicomponents.com/flow/flow-components/map) page, to trace the roof over a photograph instead of a street map.

## Troubleshooting

| Problem                                                         | Cause                                                                                                                            | Fix                                                                                                                             |
| --------------------------------------------------------------- | -------------------------------------------------------------------------------------------------------------------------------- | ------------------------------------------------------------------------------------------------------------------------------- |
| The map shows a gray empty area instead of tiles                | The OpenStreetMap tile server is not trusted by the org, or a custom **Tile Layer** URL is invalid.                              | Add `https://tile.openstreetmap.org` to **Setup > Trusted URLs**, and clear **Tile Layer** to return to the default server.     |
| At **Zoom Level** 20 the map is an empty gray canvas            | OpenStreetMap publishes no tiles past level 19 for this area.                                                                    | Keep **Zoom Level** at `19`, or switch **Tile Layer** to a provider that serves deeper zooms.                                   |
| **Save survey** creates a file, but it is not on the work order | **Content Document Linked Entity Id** is empty. The component creates the file without linking it to any record.                 | Set **Content Document Linked Entity Id** to `{!recordId}` and make sure the flow receives the record Id when it starts.        |
| Toast: "Error creating your content document"                   | **Content Document Linked Entity Id** does not resolve to a valid record Id at runtime, or the running user cannot create Files. | Check that `{!recordId}` is populated on every path that reaches the screen, and that the user can create Files on that record. |
| No drawing toolbar on the map                                   | **Map Type** is **Google Maps**, or **Enable Draw** is off.                                                                      | Set **Map Type** to **Leaflet** and turn on **Enable Draw** in the **Draw** section.                                            |
| The header reads the same on every screen                       | The flow header shows the flow label, not the screen label.                                                                      | Keep the flow label short (`Site survey`) and put the step count in a Display Text or a Progress Indicator on each screen.      |


---

# Agent Instructions
This documentation is published with GitBook. GitBook is the documentation platform designed so that both humans and AI agents can read, navigate, and reason over technical content effectively. Learn more at gitbook.com.

## Querying This Documentation
If you need additional information that is not directly available in this page, you can query the documentation dynamically by asking a question.

Perform an HTTP GET request on the current page URL with the `ask` query parameter, and the optional `goal` query parameter:

```
GET https://docs.avonnicomponents.com/projects/use-cases/site-survey-inside-a-flow.md?ask=<question>&goal=<endgoal>
```

`ask` is the immediate question: it should be specific, self-contained, and written in natural language.
`goal` is optional and describes the broader end goal you are ultimately trying to accomplish on behalf of the user. GitBook uses it to tailor the answer towards what is most useful for that goal.

The response will contain a direct answer to the question and relevant excerpts and sources from the documentation.

Use this mechanism when the answer is not explicitly present in the current page, you need clarification or additional context, or you want to retrieve related documentation sections.