> For the complete documentation index, see [llms.txt](https://docs.avonnicomponents.com/llms.txt). Markdown versions of documentation pages are available by appending `.md` to page URLs; this page is available as [Markdown](https://docs.avonnicomponents.com/projects/use-cases/revenue-cube-without-a-report.md).

# Revenue cube without a report

## Overview

Closed won revenue by region and quarter, totals on both axes, computed live from opportunities. No report builder, no dashboard. The whole tab is one **Pivot Table** Dynamic Component on a Lightning app page, aggregating Opportunity records through a Query data source. This tutorial rebuilds the **Revenue** tab of the Sales app in your own org.

## What you build

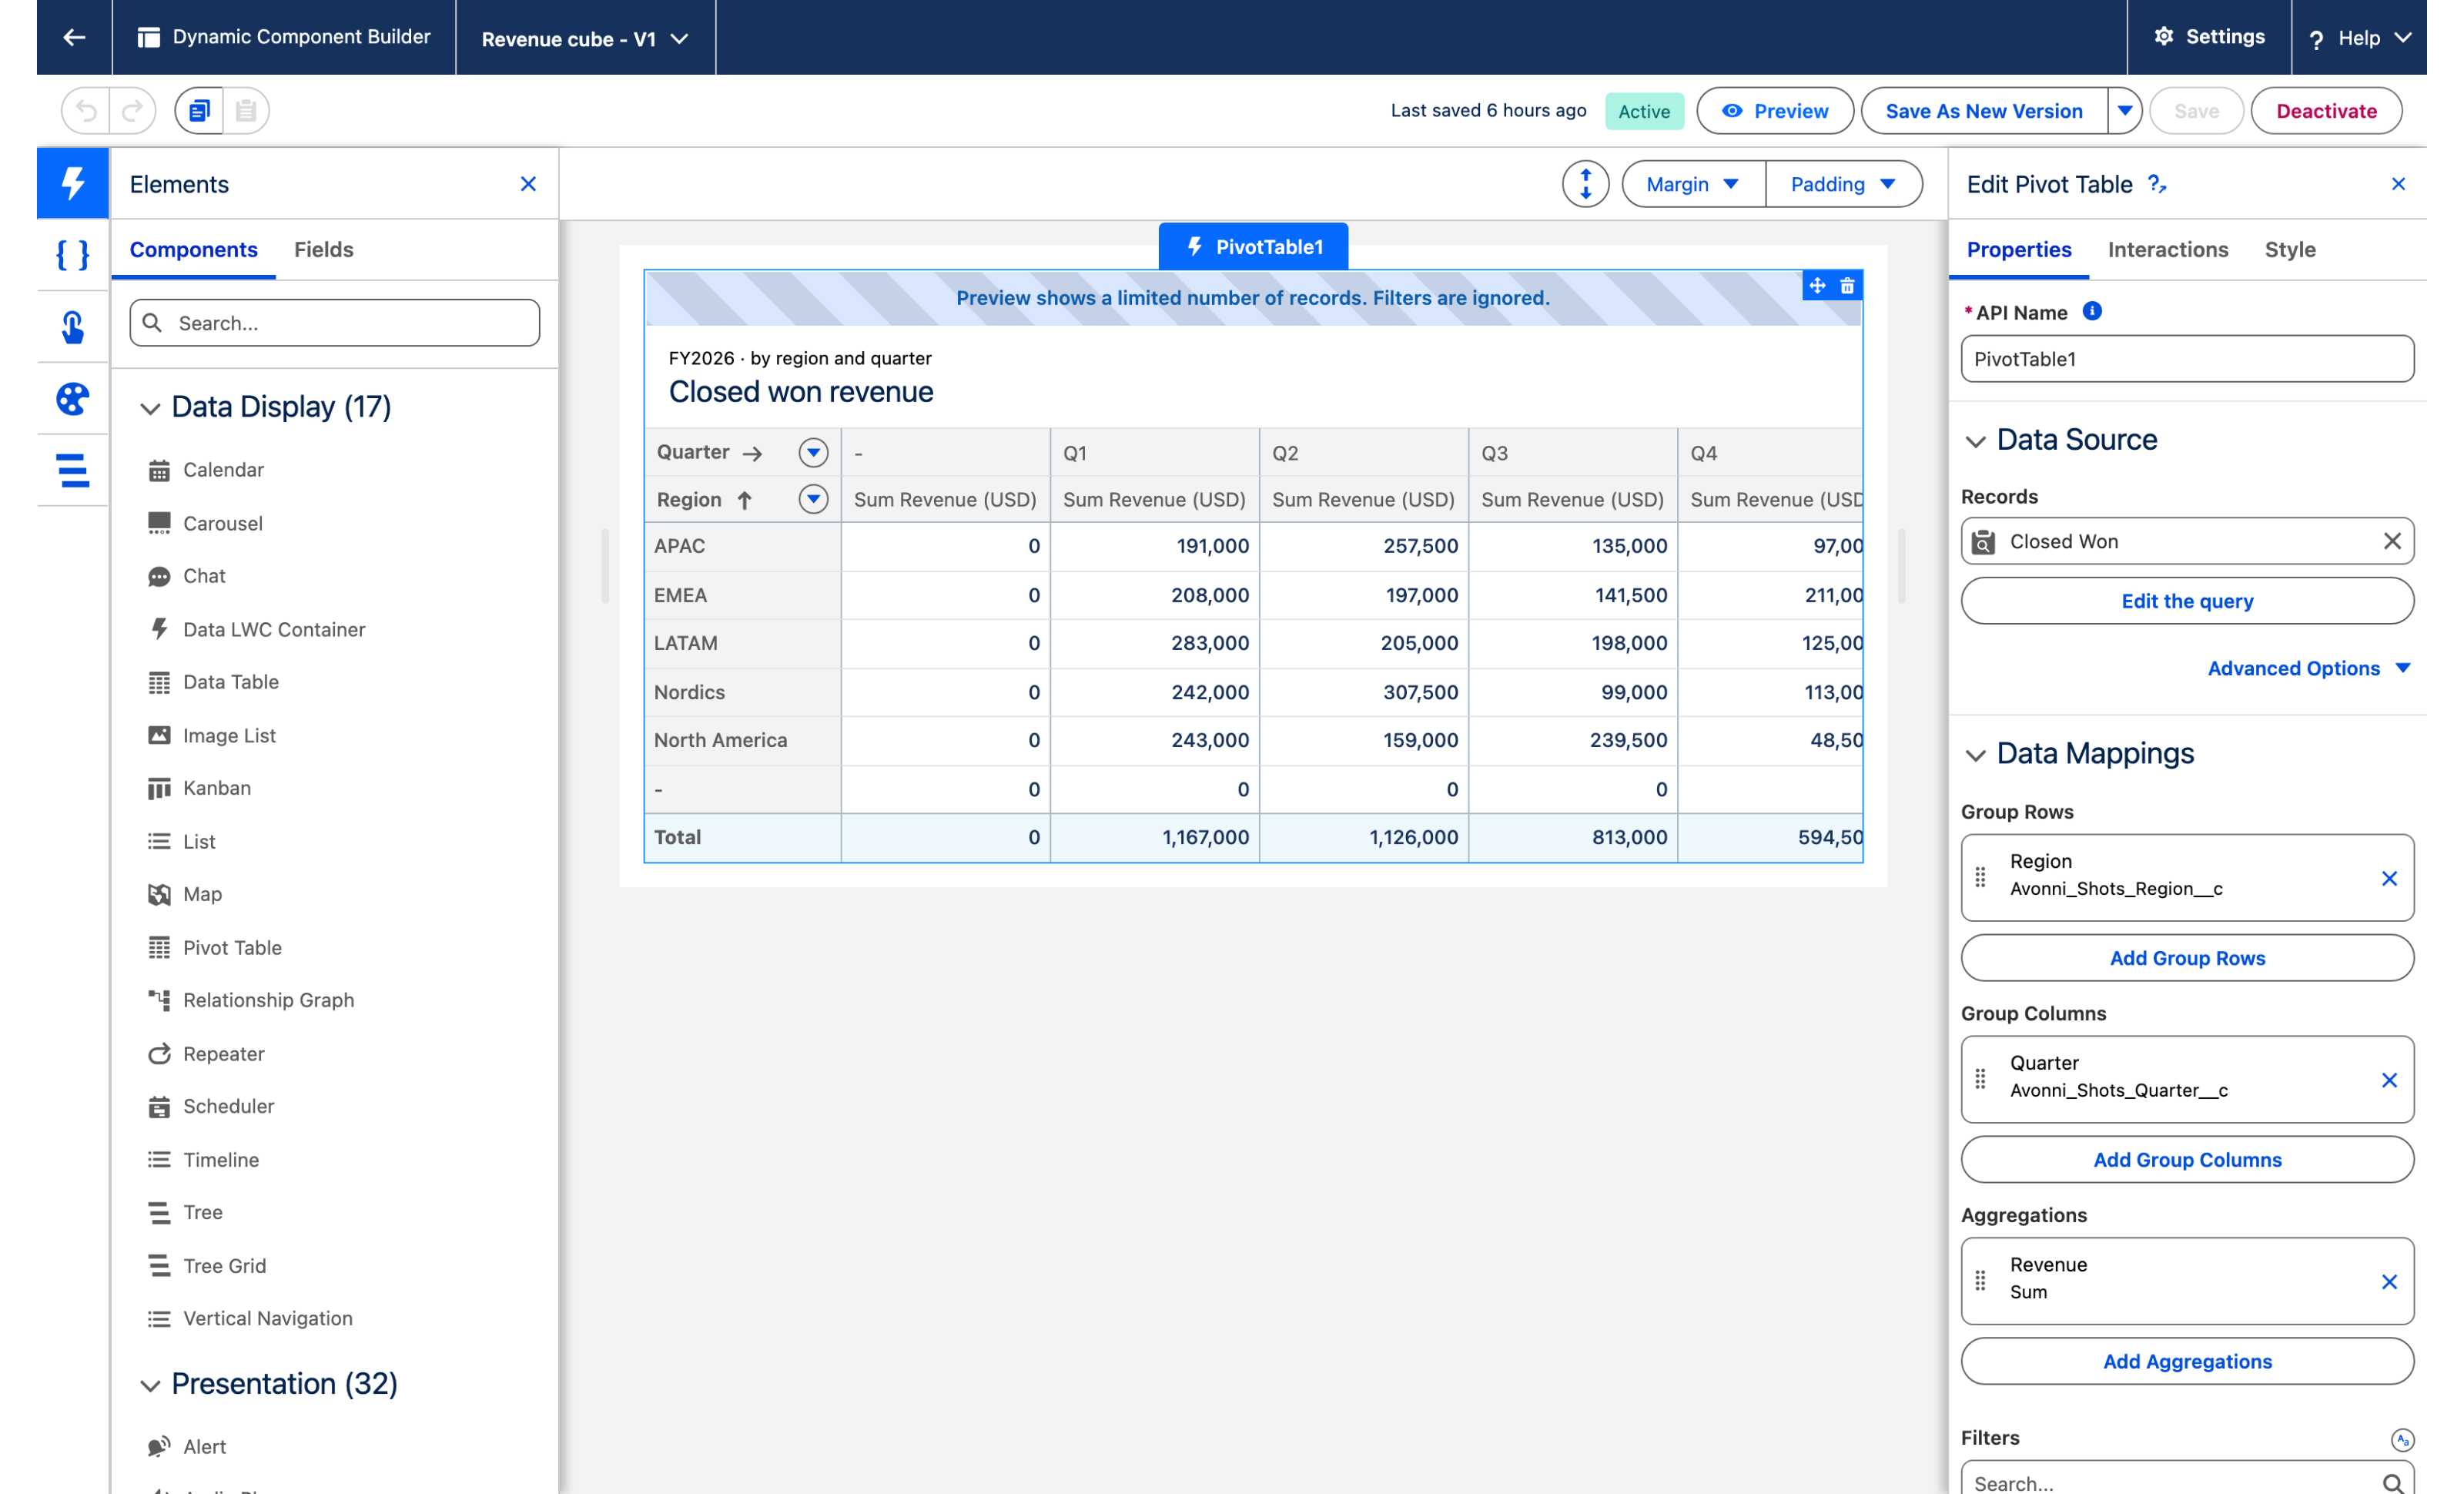
![Avonni Pivot Table on a Lightning page: closed won revenue by region and quarter with row totals, column totals and a grand total](https://3857391697-files.gitbook.io/~/files/v0/b/gitbook-x-prod.appspot.com/o/spaces%2FdHOej9Pd5IxJNGEJMZKW%2Fuploads%2FwEkBsQSCmZGT19LAV1Ea%2Fuc-05-revenue-cube.png?alt=media)

* The **Revenue** tab opens on one pivot: five regions down, four quarters across, the sum of the deals in every cell, totals on both axes and a grand total of 3,700,500 in the corner.
* The header reads `FY2026 · by region and quarter` above `Closed won revenue`.
* Every number is a whole dollar amount, no decimals, under a column labeled `Sum Revenue (USD)`.
* It reads the opportunities directly, so it is current the second a deal closes.

## Before you start

{% hint style="info" %}
**Adapt this to your own org.** The pivot reads standard opportunities, but the three fields below are ours and yours are named differently. Group the rows on whatever carries your territory and the columns on your own period, then aggregate your own amount. The two spare fields exist for a reason worth knowing before you drop them: `Quarter__c` is what makes the column headers read `Q1` to `Q4`, and `Revenue__c` is a Number rather than a Currency so the cells show whole dollars. Step 1 and **Take it further** show what the pivot looks like with `CloseDate` and `Amount` instead.
{% endhint %}

* The [Avonni Experience Components](https://appexchange.salesforce.com/appxListingDetail?listingId=2e584bb3-b5e0-415d-9347-d6567158d840) package, which carries Dynamic Components, is installed. Whoever builds the component needs the **Avonni Experiences Admin** permission set; the people who use the page need a license and **Avonni Dynamic Components User**. See [Installation & Licenses Management](https://docs.avonnicomponents.com/dynamic-components/getting-started/installation-and-licenses-management).
* A Lightning app with an app page for the pivot. The examples below use the **Sales** app and its **Revenue** tab.
* Three fields on the standard Opportunity object, next to the standard ones the pivot reads:

| Object      | Field        | Type                                                          | Role                                                   |
| ----------- | ------------ | ------------------------------------------------------------- | ------------------------------------------------------ |
| Opportunity | `StageName`  | Standard picklist                                             | Only `Closed Won` deals count                          |
|             | `CloseDate`  | Standard date                                                 | Scopes the cube to the year                            |
|             | `Amount`     | Standard currency                                             | The deal value, as the rest of the org uses it         |
|             | `Region__c`  | Picklist: `North America`, `EMEA`, `APAC`, `LATAM`, `Nordics` | The rows                                               |
|             | `Quarter__c` | Picklist: `Q1`, `Q2`, `Q3`, `Q4`                              | The columns, see step 1                                |
|             | `Revenue__c` | Number, 18 digits, 0 decimal places                           | The measure: a whole-dollar copy of Amount, see step 1 |

**Sample data.** Forty closed won opportunities, two per region and quarter, all closed in 2026. **Revenue** equals **Amount** on every one, and **Quarter** follows the close date:

| Opportunity name                        | Region        | Close date   | Amount  |
| --------------------------------------- | ------------- | ------------ | ------- |
| Meridian Foods platform rollout         | APAC          | Jan 28, 2026 | 65,500  |
| Copperline Energy annual renewal        | APAC          | Mar 5, 2026  | 125,500 |
| Northwind Distribution pilot conversion | APAC          | May 13, 2026 | 168,500 |
| Lantern Financial platform rollout      | APAC          | Jun 4, 2026  | 89,000  |
| Northwind Distribution seat expansion   | APAC          | Aug 12, 2026 | 38,000  |
| Copperline Energy pilot conversion      | APAC          | Sep 2, 2026  | 97,000  |
| Vantage Analytics pilot conversion      | APAC          | Oct 7, 2026  | 32,500  |
| Vantage Analytics platform rollout      | APAC          | Dec 3, 2026  | 64,500  |
| Northwind Distribution platform rollout | EMEA          | Feb 11, 2026 | 62,500  |
| Trailhead Outfitters platform rollout   | EMEA          | Mar 5, 2026  | 145,500 |
| Orchard Health seat expansion           | EMEA          | Apr 9, 2026  | 47,500  |
| Blue Harbor Group seat expansion        | EMEA          | Jun 4, 2026  | 149,500 |
| Northwind Distribution annual renewal   | EMEA          | Aug 12, 2026 | 26,000  |
| Meridian Foods annual renewal           | EMEA          | Sep 2, 2026  | 115,500 |
| Blue Harbor Group annual renewal        | EMEA          | Nov 10, 2026 | 53,500  |
| Trailhead Outfitters platform rollout   | EMEA          | Dec 3, 2026  | 157,500 |
| Orchard Health platform rollout         | LATAM         | Feb 11, 2026 | 103,500 |
| Trailhead Outfitters pilot conversion   | LATAM         | Mar 5, 2026  | 179,500 |
| Trailhead Outfitters seat expansion     | LATAM         | Apr 22, 2026 | 89,500  |
| Blue Harbor Group annual renewal        | LATAM         | Jun 4, 2026  | 115,500 |
| Sable & Finch pilot conversion          | LATAM         | Aug 12, 2026 | 67,000  |
| Lantern Financial pilot conversion      | LATAM         | Sep 2, 2026  | 131,000 |
| Trailhead Outfitters seat expansion     | LATAM         | Nov 10, 2026 | 89,000  |
| Copperline Energy seat expansion        | LATAM         | Dec 3, 2026  | 36,000  |
| Lantern Financial platform rollout      | Nordics       | Feb 11, 2026 | 146,000 |
| Orchard Health platform rollout         | Nordics       | Mar 5, 2026  | 96,000  |
| Cascade Logistics annual renewal        | Nordics       | May 13, 2026 | 175,500 |
| Meridian Foods seat expansion           | Nordics       | Jun 4, 2026  | 132,000 |
| Copperline Energy seat expansion        | Nordics       | Jul 21, 2026 | 46,000  |
| Copperline Energy pilot conversion      | Nordics       | Sep 2, 2026  | 53,000  |
| Vantage Analytics seat expansion        | Nordics       | Oct 20, 2026 | 72,000  |
| Orchard Health seat expansion           | Nordics       | Dec 3, 2026  | 41,000  |
| Sable & Finch pilot conversion          | North America | Jan 15, 2026 | 116,000 |
| Cascade Logistics annual renewal        | North America | Mar 5, 2026  | 127,000 |
| Copperline Energy pilot conversion      | North America | May 13, 2026 | 63,500  |
| Meridian Foods pilot conversion         | North America | Jun 4, 2026  | 95,500  |
| Blue Harbor Group platform rollout      | North America | Jul 8, 2026  | 139,500 |
| Copperline Energy annual renewal        | North America | Sep 2, 2026  | 100,000 |
| Sable & Finch pilot conversion          | North America | Nov 10, 2026 | 20,500  |
| Trailhead Outfitters platform rollout   | North America | Dec 3, 2026  | 28,000  |

If your org already holds closed won opportunities for the year, the pivot adds them in. Read the totals in the figure as what the forty deals above produce on their own.

**Permissions.** Users need Read on Opportunity and on the three custom fields. The pivot only aggregates the records Salesforce lets each user see.

## Build it

{% stepper %}
{% step %}

### Create the three fields and load the deals

1. In **Setup**, open **Object Manager**, then **Opportunity**, and add the **Region** picklist, the **Quarter** picklist and the **Revenue** number field listed above.
2. Load the forty sample opportunities, with **Stage** `Closed Won`, **Revenue** equal to **Amount**, and **Quarter** set from the close date (`Q1` for January to March, and so on).

*Why two extra fields when the data is already there:*

* **Quarter** is a picklist rather than a date grouping so that the column headers read `Q1` to `Q4`. The pivot can also group **Close Date** by quarter directly (see Take it further), but the header then shows the quarter number, `1` to `4`.
* **Revenue** is a Number field rather than **Amount** because a currency measure renders with the currency symbol and two decimals, `$191,000.00`, and no setting of the pivot changes that. A Number field with 0 decimal places renders `191,000`. The unit moves into the column label instead.
  {% endstep %}

{% step %}

### Create the Dynamic Component and add the Pivot Table

1. From the App Launcher, open the **Avonni Components App** and click **New Component**.
2. Name it `Revenue cube` and leave **Target Page Object** empty: the pivot lives on an app page.
3. Drag **Pivot Table** onto the canvas and select it. The **Edit Pivot Table** panel opens on the right with the **Properties** and **Interactions** tabs.
   {% endstep %}

{% step %}

### Connect the query

1. In the **Data Source** section, click **Create Query**.
2. Choose the **Opportunity** object.
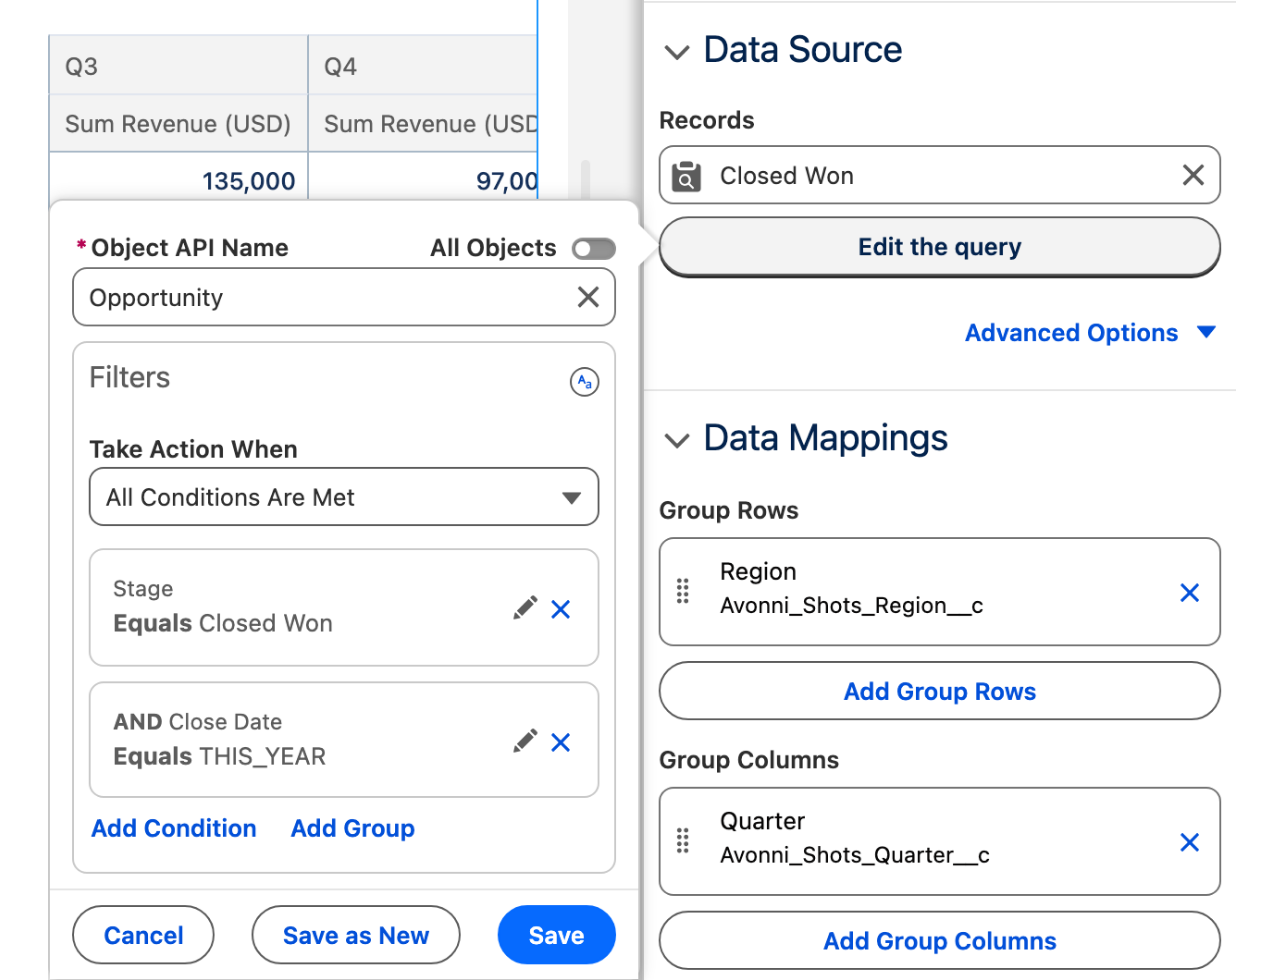
3. Under **Filters**, add `StageName` equals `Closed Won` and `CloseDate` = `THIS_YEAR`, combined with AND.
4. Click **Done**.

*Why:* the pivot only ever sees what the query returns, so the filter is where "closed won, this year" lives. The Pivot Table's query has no **Order By** and no limit to set: it aggregates on the server and sorts the result itself. The sample deals close in 2026; in a later year, filter on the year they closed. See [Query](https://docs.avonnicomponents.com/dynamic-components/component-builder/data-sources/query) for the filter operators.
{% endstep %}

{% step %}

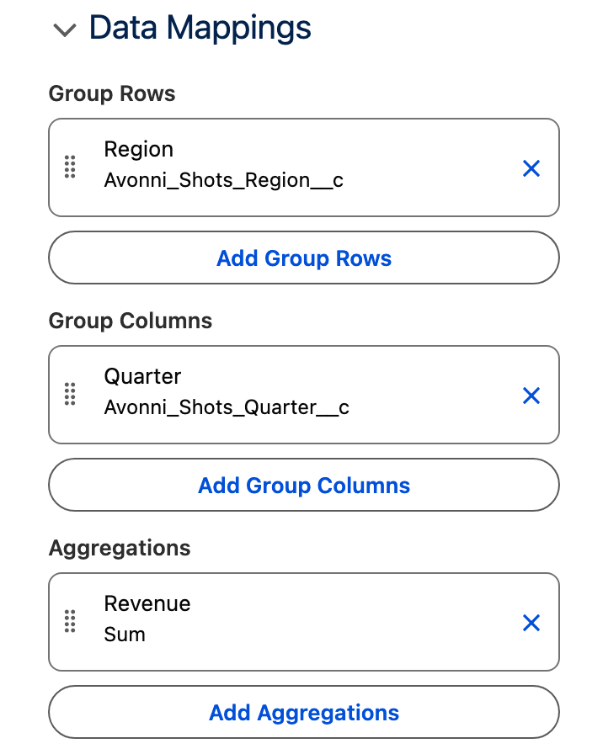
### Map the rows, the columns and the measure

In the **Data Mapping** section:

1. Under **Group Rows**, add an entry with **Field** `Region__c`.
2. Under **Group Columns**, add an entry with **Field** `Quarter__c`.
3. Under **Aggregations**, add an entry with **Field** `Revenue__c` and **Measure** **Sum**. Turn on **Custom Label** and enter `Revenue (USD)`.

*Why:* the column header is the measure followed by the field label, so the custom label makes it read `Sum Revenue (USD)`: the unit the currency symbol would have carried. Rows and columns combined are limited to three grouping fields; this cube uses two.
{% endstep %}

{% step %}

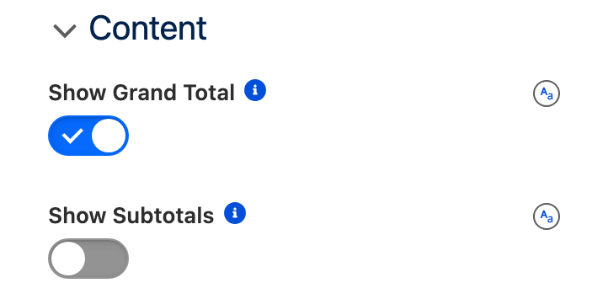
### Turn on the totals

In the **Content** section, turn on **Show Grand Total**. Leave **Show Subtotals** off.

*Why:* **Show Grand Total** adds the Total column, the Total row and the corner. Subtotals only exist with more than one row group or more than one column group, so on this cube the switch has no effect.
{% endstep %}

{% step %}

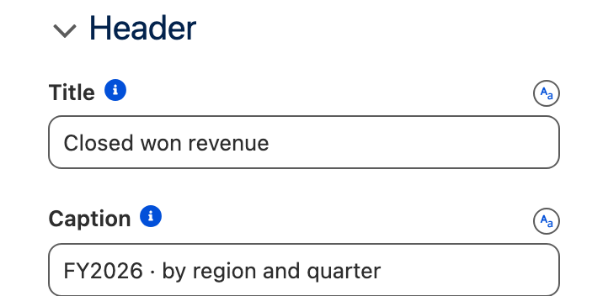
### Set the header

In the **Header** section, set **Title** to `Closed won revenue` and **Caption** to `FY2026 · by region and quarter`. The caption displays above the title.
{% endstep %}

{% step %}

### Save, activate, add to the page

1. Click **Save**, then **Activate**.
2. In **Lightning App Builder**, open the app page, drag **AX - Dynamic Component** onto it and select `Revenue cube` in its **Properties Panel**.
3. Click **Save**, then **Activate** the page for the app. See [Publishing your Dynamic Components](https://docs.avonnicomponents.com/dynamic-components/core-concepts/publishing-your-dynamic-components).
   {% endstep %}
   {% endstepper %}

## The settings that matter

| Setting                                                                                       | Value                                          | Why                                                                                                        |
| --------------------------------------------------------------------------------------------- | ---------------------------------------------- | ---------------------------------------------------------------------------------------------------------- |
| **Group Rows** **Field** (`groupRows[].field`)                                                | `Region__c`                                    | The vertical axis, one row per region, sorted by value                                                     |
| **Group Columns** **Field** (`groupColumns[].field`)                                          | `Quarter__c`                                   | The horizontal axis, `Q1` to `Q4`                                                                          |
| **Aggregations** **Field** and **Measure** (`aggregations[].field`, `aggregations[].measure`) | `Revenue__c`, **Sum**, labeled `Revenue (USD)` | The value in every cell. A Number field renders whole numbers where a Currency field renders `$191,000.00` |
| **Show Grand Total** (`showGrandTotal`)                                                       | on                                             | The Total column, the Total row and the grand total in the corner                                          |

## Try it

1. Open the **Revenue** tab. Five rows, APAC to North America, four columns, Q1 to Q4, a Total column and a Total row. The column totals read 1,167,000, 1,126,000, 813,000 and 594,500, and the corner 3,700,500.
2. Click the arrow next to **Region** in the top left corner: the rows sort the other way, North America first. Click it again.
3. Open the APAC deal `Copperline Energy pilot conversion` (Sep 2, 2026), change **Revenue** from `97,000` to `100,000` and save. Back on the tab, APAC Q3 reads 138,000, the APAC total 683,500 and the corner 3,703,500. No report was refreshed. Put the value back.

## Take it further

The same pivot exists on two other Avonni surfaces:

* [Pivot Table](https://docs.avonnicomponents.com/flow/flow-components/pivot-table) for Flow Screen Components, inside a screen flow.
* [Pivot Table](https://docs.avonnicomponents.com/lwc-components/data-driven-components/pivot-table) for LWC Components, as the `avonni-dd-pivot-table` tag in your own component.

Four variations worth trying:

* Group the columns on the date instead of the picklist: under **Group Columns**, set **Field** to `CloseDate` and **Group** to **Quarter**. No **Quarter** field to maintain, and the headers read `1` to `4`.
* Add a second row group, for instance `Account.Industry` under `Region__c`, then turn on **Show Subtotals**: each region gets a subtotal row.
* Turn on **Detail Rows** in **Content**: clicking a cell lists the deals behind it, with their **Revenue** in a column.
* Add `Region__c` under **Filters** in **Data Mapping**: a filter appears above the pivot, and the cube narrows to the regions the end user picks.

## Troubleshooting

| Problem                                                     | Cause                                                                                                                                                            | Fix                                                                                                                           |
| ----------------------------------------------------------- | ---------------------------------------------------------------------------------------------------------------------------------------------------------------- | ----------------------------------------------------------------------------------------------------------------------------- |
| The pivot is empty although the query returns records       | No row group, column group or aggregation is set.                                                                                                                | In **Data Mapping**, add at least one **Group Rows** entry and one **Aggregations** entry with a numeric field and a measure. |
| Every cell shows a currency symbol and two decimals         | The aggregated field is a Currency field. The pivot renders a currency measure in the org's currency format, two decimals included, and has no decimals setting. | Aggregate a Number field with 0 decimal places, such as `Revenue__c`, and name the unit in the custom label.                  |
| The columns read `1`, `2`, `3`, `4` instead of `Q1` to `Q4` | The column group is **Close Date** with **Group** set to **Quarter**. A date group labels its columns with the calendar quarter number.                          | Group on the `Quarter__c` picklist, or keep the date group and read the numbers as quarters.                                  |
| A quarter is missing from the columns                       | No closed won deal in that quarter matched the query. The pivot only shows the values present in the records it aggregates.                                      | Nothing to fix on the pivot: the column appears with the first deal. Check the query filter if deals exist.                   |
| **Show Subtotals** is on and nothing changes                | Subtotals need more than one row group or more than one column group. With one group per axis, the only total is the grand total.                                | Add a second group on one axis, or rely on **Show Grand Total**.                                                              |


---

# Agent Instructions
This documentation is published with GitBook. GitBook is the documentation platform designed so that both humans and AI agents can read, navigate, and reason over technical content effectively. Learn more at gitbook.com.

## Querying This Documentation
If you need additional information that is not directly available in this page, you can query the documentation dynamically by asking a question.

Perform an HTTP GET request on the current page URL with the `ask` query parameter, and the optional `goal` query parameter:

```
GET https://docs.avonnicomponents.com/projects/use-cases/revenue-cube-without-a-report.md?ask=<question>&goal=<endgoal>
```

`ask` is the immediate question: it should be specific, self-contained, and written in natural language.
`goal` is optional and describes the broader end goal you are ultimately trying to accomplish on behalf of the user. GitBook uses it to tailor the answer towards what is most useful for that goal.

The response will contain a direct answer to the question and relevant excerpts and sources from the documentation.

Use this mechanism when the answer is not explicitly present in the current page, you need clarification or additional context, or you want to retrieve related documentation sections.