> For the complete documentation index, see [llms.txt](https://docs.avonnicomponents.com/llms.txt). Markdown versions of documentation pages are available by appending `.md` to page URLs; this page is available as [Markdown](https://docs.avonnicomponents.com/projects/use-cases/bookings-stacked-by-region.md).

# Bookings stacked by region

## Overview

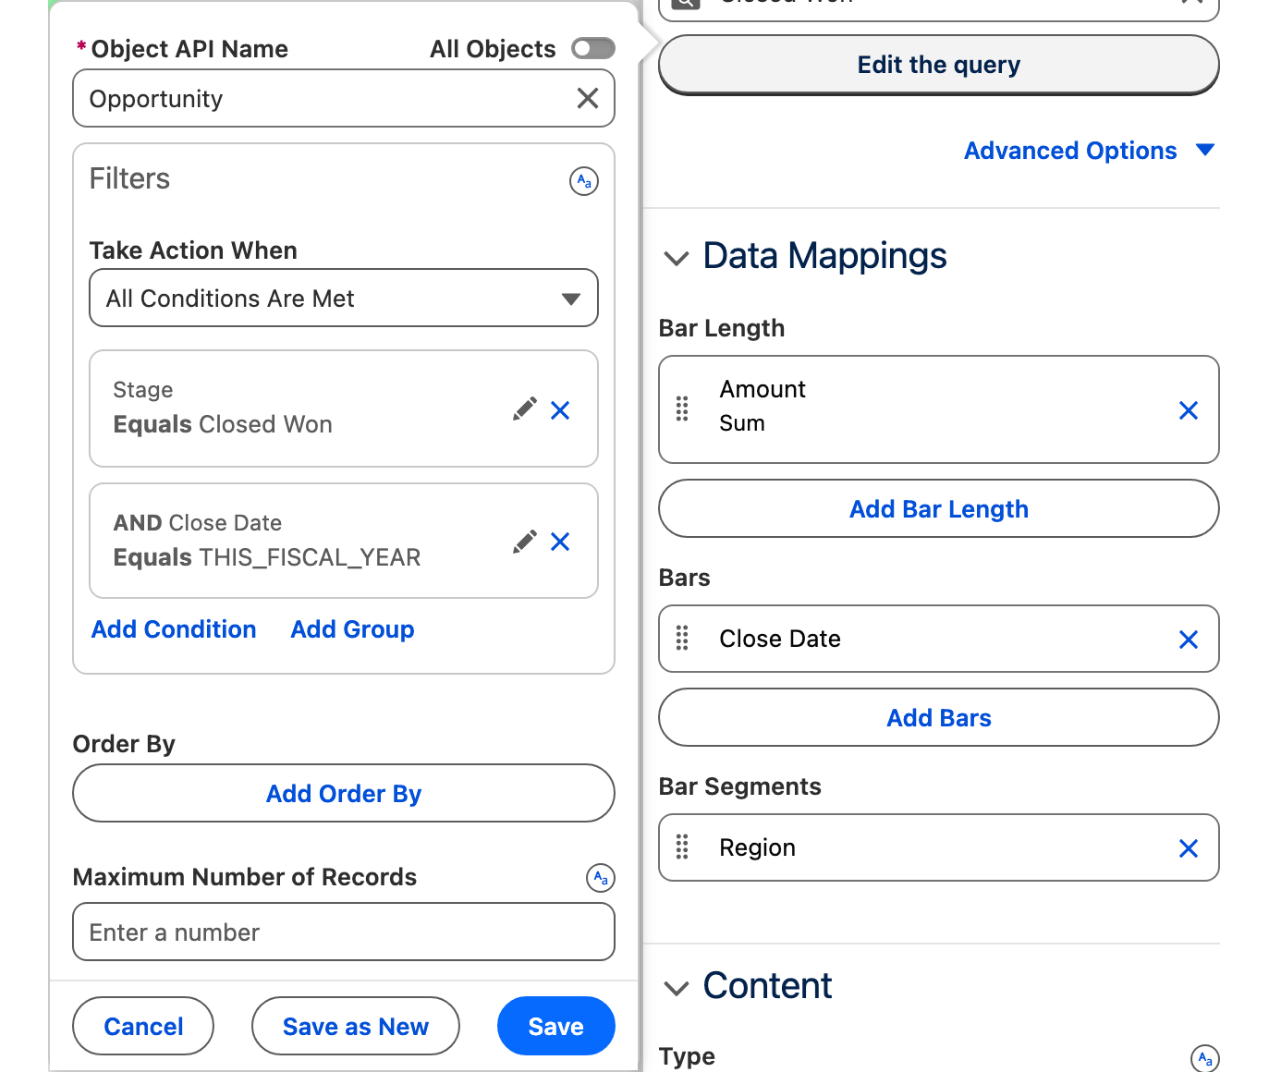
Twelve months of closed won bookings, every column stacked by region, drawn live from the opportunities on one tab of the Sales app. Same data as the revenue pivot, so the two always agree. The whole tab is one **Chart** Dynamic Component, a stacked column chart reading Opportunity through a Query data source, deployed on a Lightning app page. This tutorial rebuilds the **Bookings** tab of the Northwind Distribution Sales app in your own org.

## What you build

![Avonni Chart on a Lightning tab: twelve stacked columns of closed won bookings by month and region, with a tooltip showing May, North America and $63,500](https://3857391697-files.gitbook.io/~/files/v0/b/gitbook-x-prod.appspot.com/o/spaces%2FdHOej9Pd5IxJNGEJMZKW%2Fuploads%2FJZwx7FUKFZXxrw84mMEu%2Fuc-10-bookings-by-region.png?alt=media)

* The **Bookings** tab of the Sales app opens on one chart: twelve columns, January to December, one per month of the fiscal year.
* Each column is stacked by region, five regions in the **Ocean** palette, the sum of Amount on the Y axis.
* Hover a segment and the tooltip gives the month, the region and the amount in dollars, no decimals. In the figure: May, North America, $63,500.
* No legend: the region is read on hover (see Troubleshooting for why).
* It reads the opportunities directly, like the revenue cube next door, so a deal closed this morning is in this morning's chart.

## Before you start

{% hint style="info" %}
**Adapt this to your own org.** The chart reads standard opportunities. **Region** is the one custom field here, and yours may be named differently or live on the account: stack the columns on whatever splits your business, and group the bars on your own date field. The fiscal year matters more than the names. The filter uses `THIS_FISCAL_YEAR`, so an org whose fiscal year does not follow the calendar gets twelve different columns.
{% endhint %}

* The [Avonni Experience Components](https://appexchange.salesforce.com/appxListingDetail?listingId=2e584bb3-b5e0-415d-9347-d6567158d840) package, which carries Dynamic Components, is installed. Whoever builds the component needs the **Avonni Experiences Admin** permission set; the people who use the page need a license and **Avonni Dynamic Components User**. See [Installation & Licenses Management](https://docs.avonnicomponents.com/dynamic-components/getting-started/installation-and-licenses-management).
* A Lightning app to host the chart. The examples use the **Sales** app of Northwind Distribution, where the chart is the **Bookings** tab, next to **Revenue**.
* The chart reads standard Opportunity fields plus one custom picklist:

| Object      | Field       | Type                                                          | Role                                       |
| ----------- | ----------- | ------------------------------------------------------------- | ------------------------------------------ |
| Opportunity | `Name`      | Text (standard)                                               | The deal, `Sable & Finch pilot conversion` |
|             | `StageName` | Picklist (standard)                                           | The filter keeps `Closed Won` only         |
|             | `CloseDate` | Date (standard)                                               | The month of each column                   |
|             | `Amount`    | Currency (standard)                                           | The height of each segment                 |
|             | `Region__c` | Picklist: `North America`, `EMEA`, `APAC`, `LATAM`, `Nordics` | The stacking, one color per value          |

**Sample data.** Forty closed won opportunities, two per region and quarter, spread so that every month of 2026 holds at least two. All have **Stage** `Closed Won`; the account is yours to pick (the customer is in the name). Amounts are multiples of 500 so the totals read cleanly.

| Opportunity                             | Close date   | Amount  | Region        |
| --------------------------------------- | ------------ | ------- | ------------- |
| Sable & Finch pilot conversion          | Jan 15, 2026 | 116,000 | North America |
| Meridian Foods platform rollout         | Jan 28, 2026 | 65,500  | APAC          |
| Northwind Distribution platform rollout | Feb 11, 2026 | 62,500  | EMEA          |
| Orchard Health platform rollout         | Feb 11, 2026 | 103,500 | LATAM         |
| Lantern Financial platform rollout      | Feb 11, 2026 | 146,000 | Nordics       |
| Copperline Energy annual renewal        | Mar 5, 2026  | 125,500 | APAC          |
| Trailhead Outfitters platform rollout   | Mar 5, 2026  | 145,500 | EMEA          |
| Trailhead Outfitters pilot conversion   | Mar 5, 2026  | 179,500 | LATAM         |
| Orchard Health platform rollout         | Mar 5, 2026  | 96,000  | Nordics       |
| Cascade Logistics annual renewal        | Mar 5, 2026  | 127,000 | North America |
| Orchard Health seat expansion           | Apr 9, 2026  | 47,500  | EMEA          |
| Trailhead Outfitters seat expansion     | Apr 22, 2026 | 89,500  | LATAM         |
| Northwind Distribution pilot conversion | May 13, 2026 | 168,500 | APAC          |
| Cascade Logistics annual renewal        | May 13, 2026 | 175,500 | Nordics       |
| Copperline Energy pilot conversion      | May 13, 2026 | 63,500  | North America |
| Lantern Financial platform rollout      | Jun 4, 2026  | 89,000  | APAC          |
| Blue Harbor Group seat expansion        | Jun 4, 2026  | 149,500 | EMEA          |
| Blue Harbor Group annual renewal        | Jun 4, 2026  | 115,500 | LATAM         |
| Meridian Foods seat expansion           | Jun 4, 2026  | 132,000 | Nordics       |
| Meridian Foods pilot conversion         | Jun 4, 2026  | 95,500  | North America |
| Blue Harbor Group platform rollout      | Jul 8, 2026  | 139,500 | North America |
| Copperline Energy seat expansion        | Jul 21, 2026 | 46,000  | Nordics       |
| Northwind Distribution seat expansion   | Aug 12, 2026 | 38,000  | APAC          |
| Northwind Distribution annual renewal   | Aug 12, 2026 | 26,000  | EMEA          |
| Sable & Finch pilot conversion          | Aug 12, 2026 | 67,000  | LATAM         |
| Copperline Energy pilot conversion      | Sep 2, 2026  | 97,000  | APAC          |
| Meridian Foods annual renewal           | Sep 2, 2026  | 115,500 | EMEA          |
| Lantern Financial pilot conversion      | Sep 2, 2026  | 131,000 | LATAM         |
| Copperline Energy pilot conversion      | Sep 2, 2026  | 53,000  | Nordics       |
| Copperline Energy annual renewal        | Sep 2, 2026  | 100,000 | North America |
| Vantage Analytics pilot conversion      | Oct 7, 2026  | 32,500  | APAC          |
| Vantage Analytics seat expansion        | Oct 20, 2026 | 72,000  | Nordics       |
| Blue Harbor Group annual renewal        | Nov 10, 2026 | 53,500  | EMEA          |
| Trailhead Outfitters seat expansion     | Nov 10, 2026 | 89,000  | LATAM         |
| Sable & Finch pilot conversion          | Nov 10, 2026 | 20,500  | North America |
| Vantage Analytics platform rollout      | Dec 3, 2026  | 64,500  | APAC          |
| Trailhead Outfitters platform rollout   | Dec 3, 2026  | 157,500 | EMEA          |
| Copperline Energy seat expansion        | Dec 3, 2026  | 36,000  | LATAM         |
| Orchard Health seat expansion           | Dec 3, 2026  | 41,000  | Nordics       |
| Trailhead Outfitters platform rollout   | Dec 3, 2026  | 28,000  | North America |

The filter in step 3 uses the fiscal year. The figure assumes a fiscal year that follows the calendar year, the Salesforce default. If yours starts in another month, shift the close dates into your fiscal year or filter on `THIS_YEAR` instead.

**Permissions.** Users who open the tab need Read on Opportunity, Read field-level security on **Region**, and the **Avonni Dynamic Components User** permission set. The query runs with the user's own permissions and sharing, so a rep with private opportunities sees the chart of what they can see.

## Build it

{% stepper %}
{% step %}

### Create the Region field and load the opportunities

1. In **Setup**, open **Object Manager**, then **Opportunity**, then **Fields & Relationships**, and create the **Region** picklist (`Region__c`) with the five values above.
2. Create or import the forty opportunities, all with **Stage** `Closed Won` and a **Region**.

*Why:* the chart aggregates records when the page loads. Nothing is precomputed, so the deals must exist as opportunities with a region on each.
{% endstep %}

{% step %}

### Create the Dynamic Component and add the Chart

1. Open the **Avonni Components** app and click **New Component**. Name the component `Bookings by region` and leave the **Target Page Object** empty.
2. From the **Component Library**, drag **Chart** onto the **Canvas** and pick **Stacked Column Chart** in the preset list.
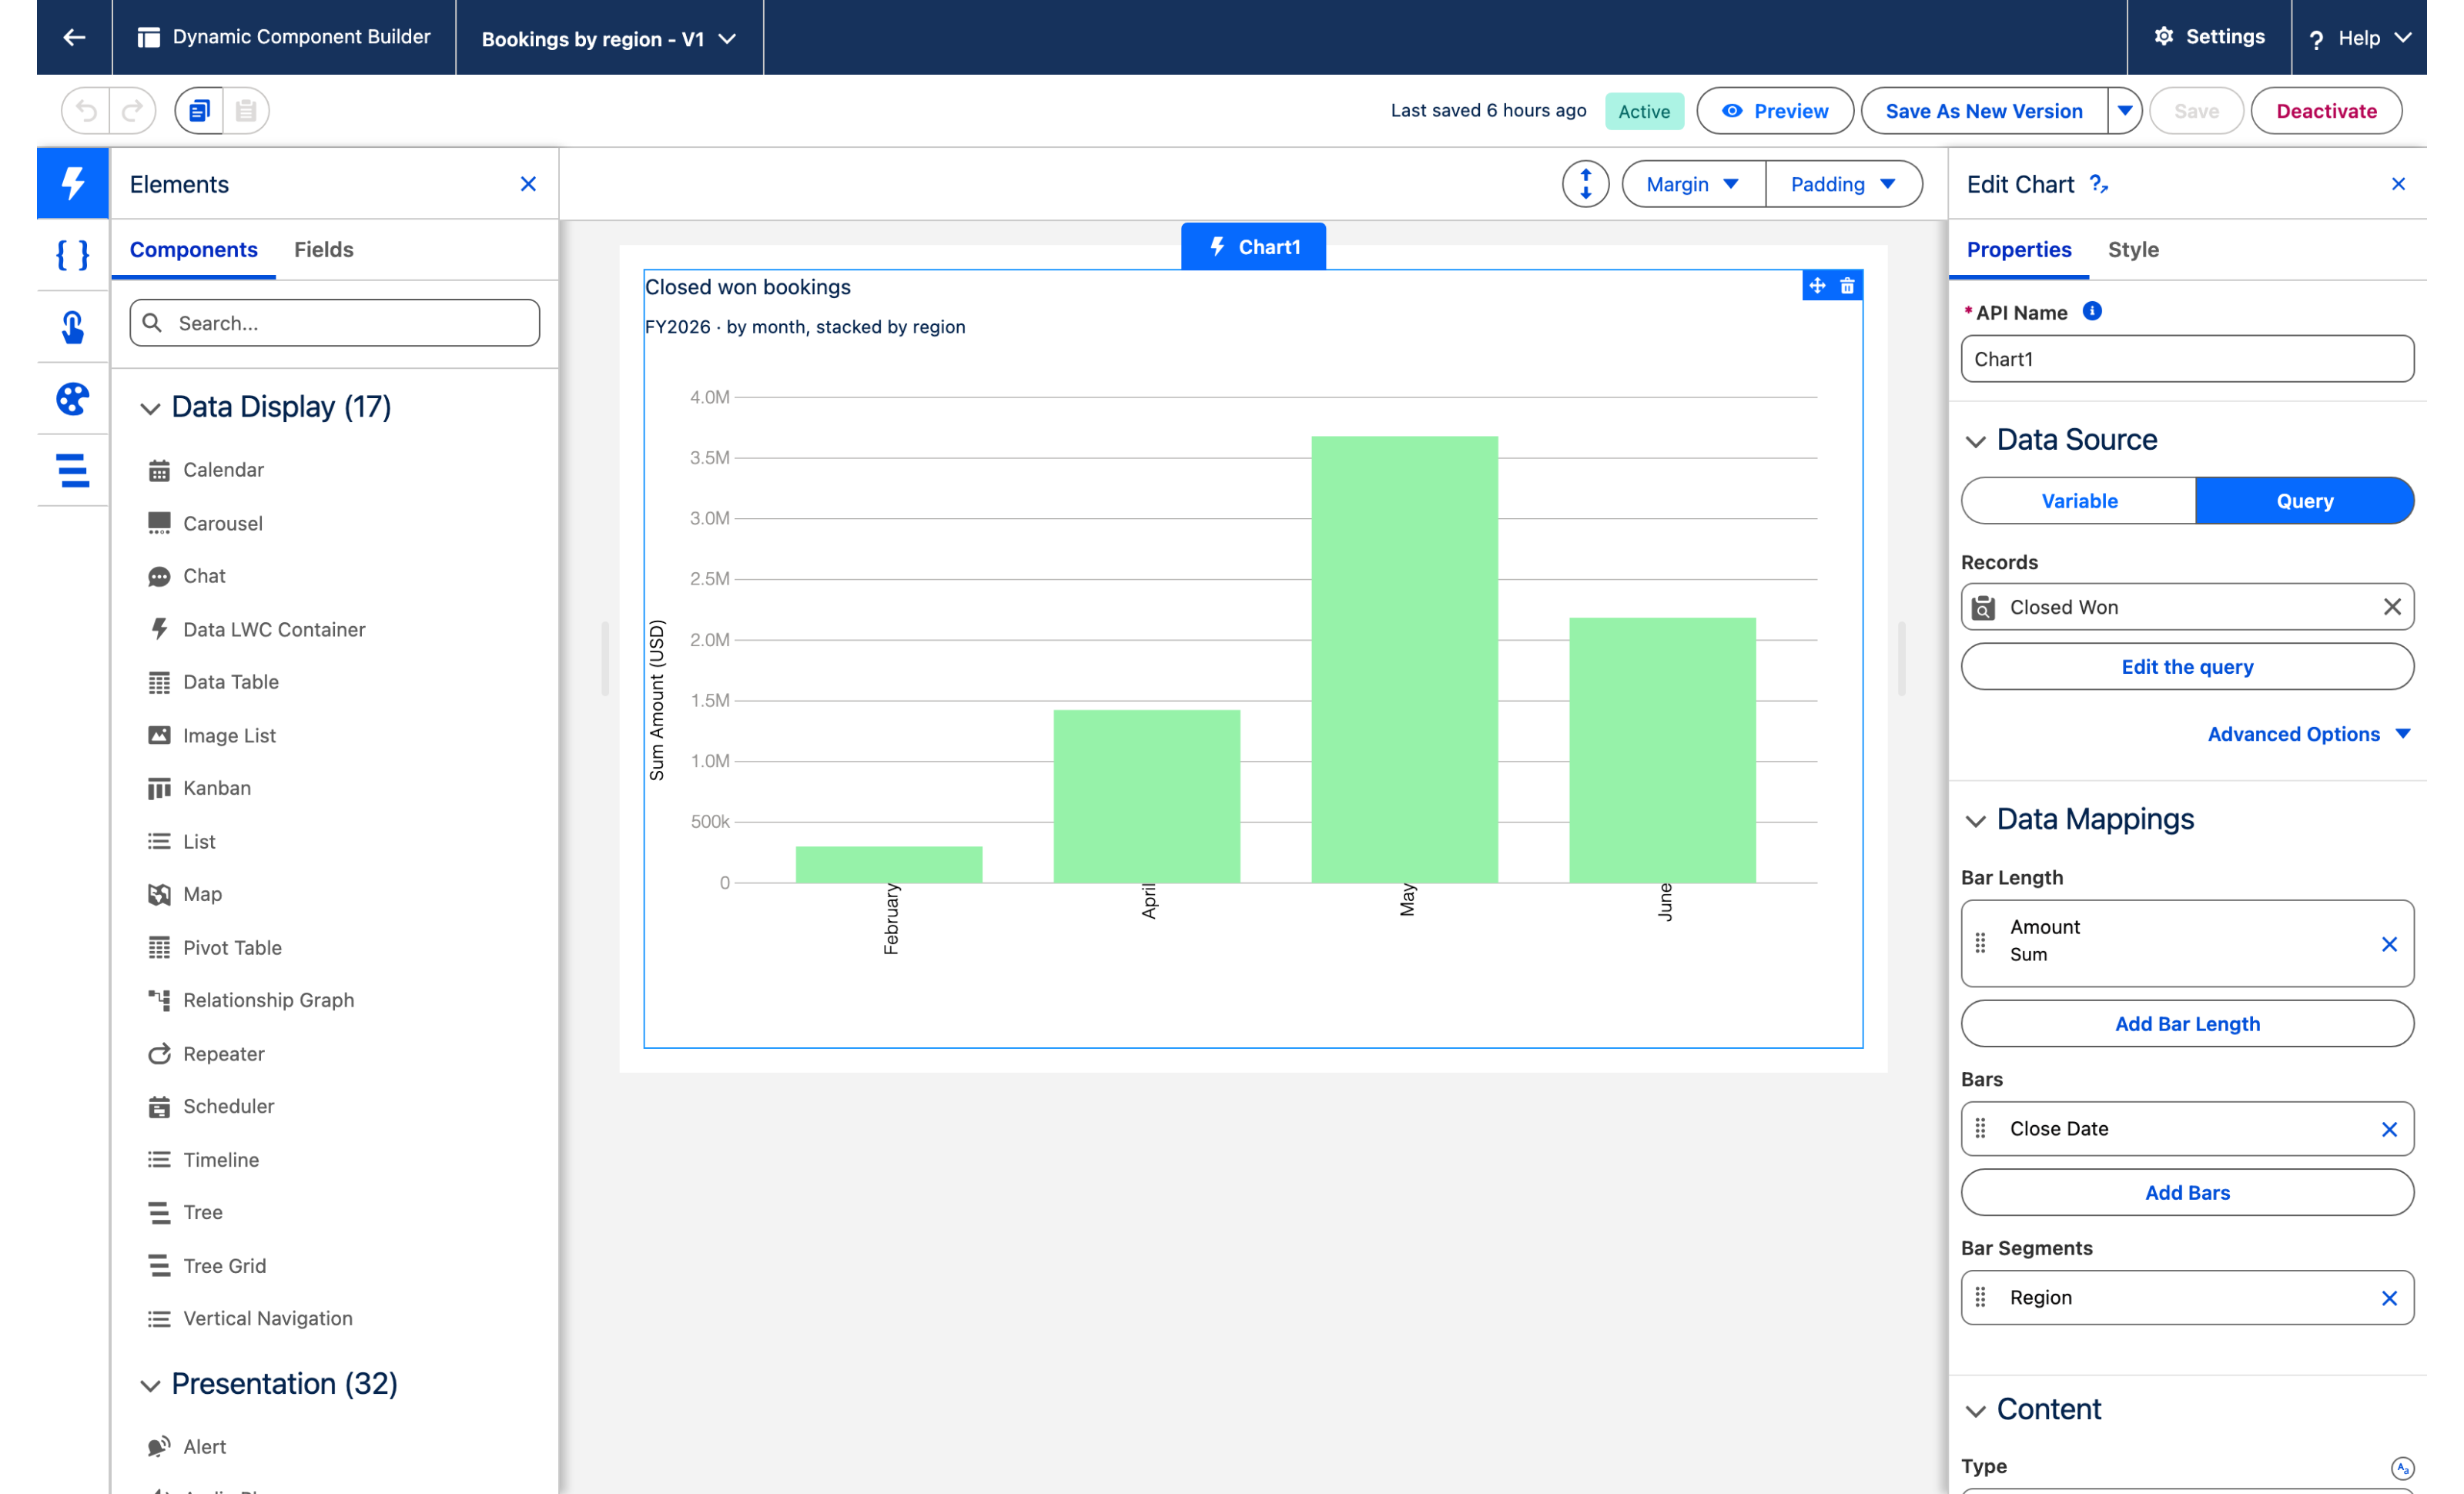
3. Select the chart. The **Edit Chart** panel opens on the right, with its **Properties** and **Interactions** tabs.

*Why:* the chart lives on an app page and reads org-wide data, so it needs no record context (see [Target Page Object](https://docs.avonnicomponents.com/dynamic-components/core-concepts/target-page-object)). Every preset is the same Chart component: **Type** can be changed later in the **Content** group.
{% endstep %}

{% step %}

### Connect the query

1. In **Data Source**, select **Query**.
2. **Object**: `Opportunity`.
3. Add two filter conditions:
   * **Field** `StageName`, **Operator** equals, **Value** `Closed Won`.
   * **Field** `CloseDate`, **Operator** equals, **Value** the date literal **This Fiscal Year** (`THIS_FISCAL_YEAR`).

Both conditions are combined with AND. See [Query](https://docs.avonnicomponents.com/dynamic-components/component-builder/data-sources/query) for filters and grouping.

*Why:* the chart sums whatever the query returns. Filtering on the stage keeps open and lost deals out of the bookings; filtering on the fiscal year keeps the chart to twelve columns and makes it roll over on its own next year.
{% endstep %}

{% step %}

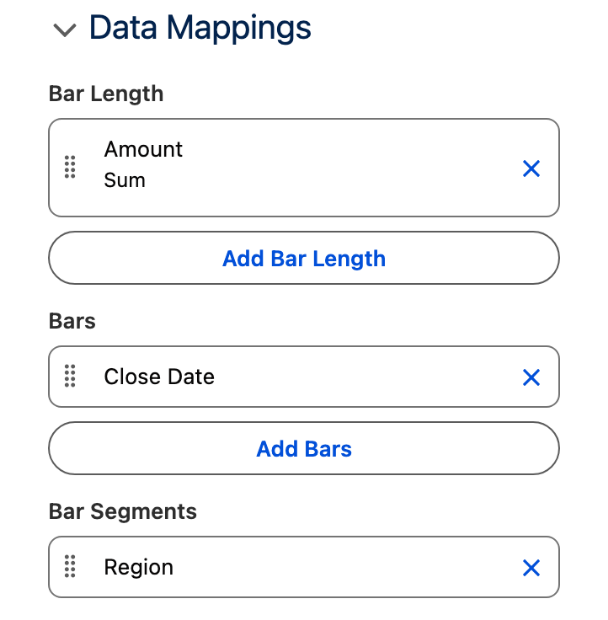
### Map the months, the amounts and the regions

In **Data Mappings**:

1. Under **Bars**, click **Add**: **Field** `CloseDate`, **Group** **Month**, and turn on **Display Full Month Label**.
2. Under **Bar Length**, click **Add**: **Field** `Amount`, **Measures** **Sum**, **Format Style** **Currency Rounded**, **Multiplier** `1`.
3. Under **Bar Segments**, click **Add**: **Field** `Region__c`.

*Why:* **Bars** decide the columns (one per month), **Bar Length** their height (the sum of Amount), **Bar Segments** the split inside each column (one region per color). **Month** rather than **Year-Month**: the latter labels the columns `2026-January`. **Currency Rounded** prints `$63,500`, not `$63,500.00`.
{% endstep %}

{% step %}

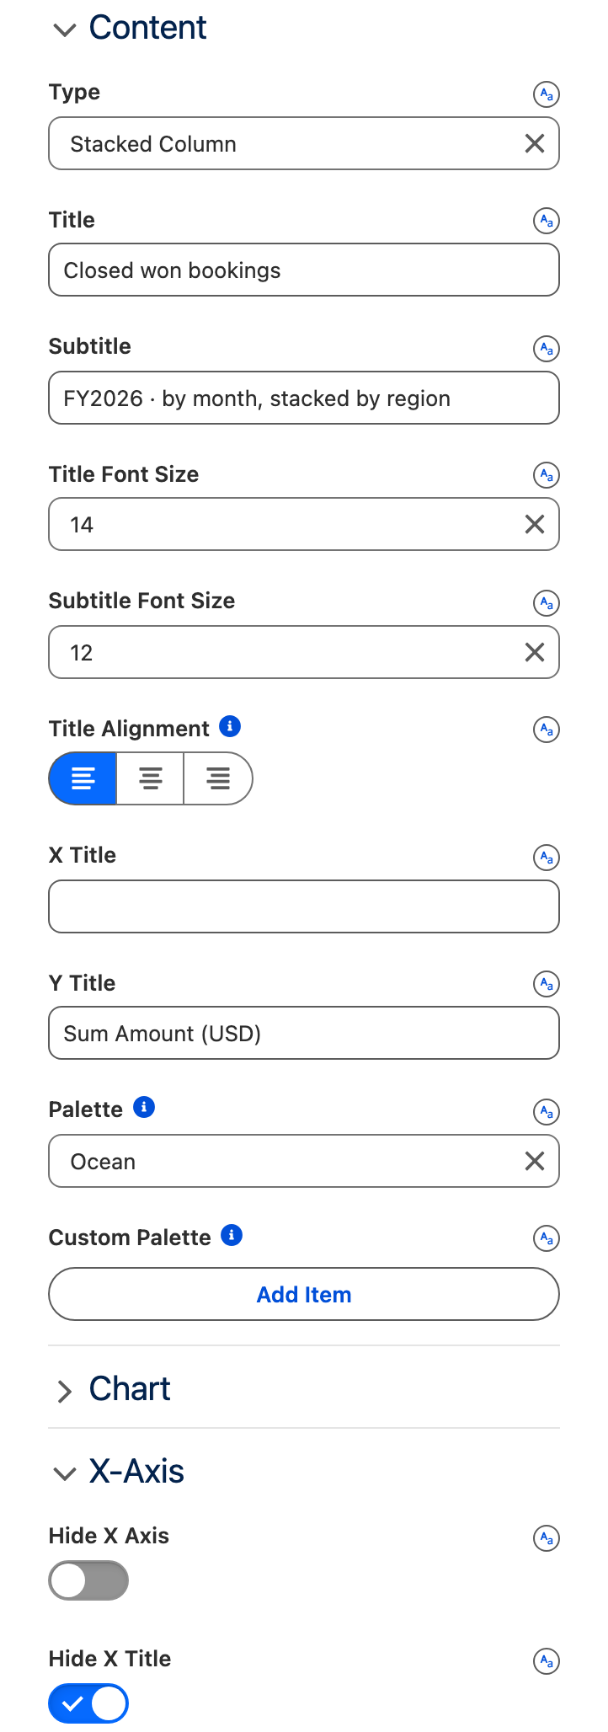
### Title the chart

In the **Content** group:

1. **Type** reads **Stacked Column**. Leave it.
2. **Title** `Closed won bookings`, **Subtitle** `FY2026 · by month, stacked by region`, **Title Alignment** **Left**.
3. **Y Title** `Sum Amount (USD)`, **X Title** empty.
4. **Palette** **Ocean**.

In the **X-Axis** group, turn on **Hide X Title**.

*Why:* the month names under the columns need no axis title. The Y title tells the reader what the height is, and in which currency.
{% endstep %}

{% step %}

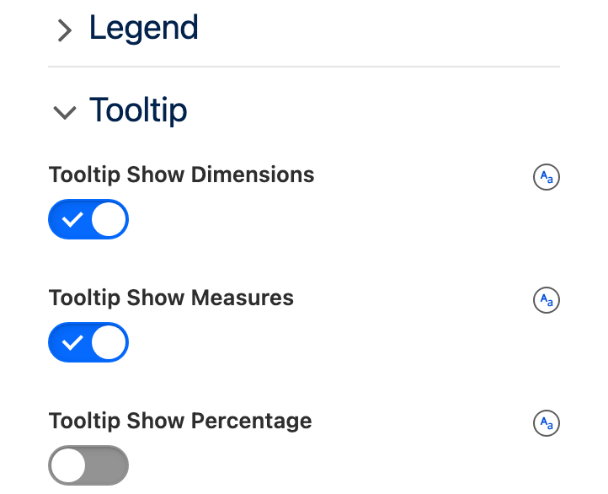
### Turn on the tooltip, leave the legend and the values off

1. In the **Tooltip** group, turn on **Tooltip Show Dimensions** and **Tooltip Show Measures**.
2. In the **Legend** group, leave **Show Legend** off.
3. In the **Chart** group, leave **Show Values** off.

*Why:* the tooltip is where the reader gets the region and the amount, so both toggles are on; the tooltip renders only when at least one is. The legend stays off because of a product limitation on stacked charts (see Troubleshooting), and forty amounts printed inside the segments would be unreadable.
{% endstep %}

{% step %}

### Preview, save, activate, add to an app page

1. Click **Preview** and check the twelve columns, then **Save**.
2. Click **Activate** and follow [Publishing your Dynamic Components](https://docs.avonnicomponents.com/dynamic-components/core-concepts/publishing-your-dynamic-components): in **Lightning App Builder**, create an **App Page** with one region, drag **AX - Dynamic Component** into it (under **Custom - Managed**) and select `Bookings by region` in its properties.
3. **Save** and **Activate** the page, and add it to the **Sales** app as a tab named **Bookings**, next to **Revenue**.

*Why:* the component is built once in the Avonni Components app and placed on as many pages as you like. If you installed the legacy standalone Dynamic Components package, the component to drag is named **Avonni Dynamic Component**.
{% endstep %}
{% endstepper %}

## The settings that matter

| Setting                                                                                                                                           | Value                                                                                                          | Why                                                                                                            |
| ------------------------------------------------------------------------------------------------------------------------------------------------- | -------------------------------------------------------------------------------------------------------------- | -------------------------------------------------------------------------------------------------------------- |
| **Type** (`chartType`)                                                                                                                            | **Stacked Column**                                                                                             | One column per month, split by region.                                                                         |
| **Bars** (`itemsSObjectMapping.bars`)                                                                                                             | **Field** `CloseDate`, **Group** **Month**, **Display Full Month Label** on                                    | Twelve columns labeled January to December, in calendar order. **Year-Month** would label them `2026-January`. |
| **Bar Length** (`itemsSObjectMapping.barLength`)                                                                                                  | **Field** `Amount`, **Measures** **Sum**, **Format Style** **Currency Rounded** (`formatStylePreset` `$#,###`) | The height of each column and the amount in the tooltip, in whole dollars.                                     |
| **Bar Segments** (`itemsSObjectMapping.barSegments`)                                                                                              | **Field** `Region__c`                                                                                          | The stacking. Offered on the stacked chart types only.                                                         |
| **Show Legend** (`showLegend`) off, **Tooltip Show Dimensions** and **Tooltip Show Measures** (`tooltipShowDimensions`, `tooltipShowMeasures`) on |                                                                                                                | The region is read on hover, not in a legend: product limitation dated September 5, 2026, see Troubleshooting. |

## Try it

1. Hover the top segment of the **May** column. The tooltip reads Close Date (month) May, Region North America, Sum of Amount $63,500.
2. Compare with the data: March is the tallest column at $673,500, the twelve columns add up to $3,700,500, and the four quarters read $1,167,000, $1,126,000, $813,000 and $594,500. These are the totals of the revenue pivot built from the same opportunities.
3. Close one more opportunity in any region this month and reload the tab: its segment grows by the amount. No report to rerun.

## Take it further

The same Chart exists for Flow Screen Components: [Chart](https://docs.avonnicomponents.com/flow/flow-components/chart), inside a screen flow, with the same **Bars**, **Bar Length** and **Bar Segments** mapping. Experience Sites and LWC Components have no Chart component today.

Three variations worth trying:

* Turn on **Normalize Values** in the **Chart** group: every column becomes 100% and the chart compares regional shares month by month.
* Set **Group** to **Quarter** under **Bars**: four columns, the same numbers as the Total row of the revenue pivot.
* Switch **Type** to **Stacked Bar** for a horizontal version, when the chart sits in a narrow region.

## Troubleshooting

| Problem                                                                                                        | Cause                                                                                                                                                                                | Fix                                                                                                                                                                                                                           |
| -------------------------------------------------------------------------------------------------------------- | ------------------------------------------------------------------------------------------------------------------------------------------------------------------------------------ | ----------------------------------------------------------------------------------------------------------------------------------------------------------------------------------------------------------------------------- |
| Turning on **Show Legend** lists dozens of entries, one per month and region pair, instead of the five regions | On a stacked chart the legend is built per month and region combination. Product limitation as of September 5, 2026, reported to the Avonni team.                                    | Leave **Show Legend** off and let the tooltip name the region. This page will be updated when the product is.                                                                                                                 |
| The tooltip names the region twice                                                                             | On a stacked chart the tooltip lists the segment dimension in its header, then again next to the color swatch of the hovered segment. Product behavior as of September 5, 2026.      | Nothing to configure. The month, the region and the amount are correct; read the region once.                                                                                                                                 |
| Hovering a segment shows no tooltip                                                                            | **Tooltip Show Dimensions** and **Tooltip Show Measures** are both off. The tooltip renders only when at least one is on.                                                            | Turn both on, as the figure does.                                                                                                                                                                                             |
| The month labels read `2026-January`                                                                           | **Group** under **Bars** is set to **Year-Month**.                                                                                                                                   | Set **Group** to **Month** and keep **Display Full Month Label** on.                                                                                                                                                          |
| Amounts are printed inside every segment                                                                       | **Show Values** is on in the **Chart** group.                                                                                                                                        | Turn it off. The tooltip carries the amount.                                                                                                                                                                                  |
| The chart is blank or reads No Data                                                                            | The filter returns nothing: no opportunity is Closed Won in the current fiscal year, the org's fiscal year does not follow the calendar, or the running user cannot see the records. | Check the two conditions in a report with the same filter. If your fiscal year is offset, filter on `THIS_YEAR` or on an explicit date range. Sharing and field-level security apply to the query as they do everywhere else. |


---

# Agent Instructions
This documentation is published with GitBook. GitBook is the documentation platform designed so that both humans and AI agents can read, navigate, and reason over technical content effectively. Learn more at gitbook.com.

## Querying This Documentation
If you need additional information that is not directly available in this page, you can query the documentation dynamically by asking a question.

Perform an HTTP GET request on the current page URL with the `ask` query parameter, and the optional `goal` query parameter:

```
GET https://docs.avonnicomponents.com/projects/use-cases/bookings-stacked-by-region.md?ask=<question>&goal=<endgoal>
```

`ask` is the immediate question: it should be specific, self-contained, and written in natural language.
`goal` is optional and describes the broader end goal you are ultimately trying to accomplish on behalf of the user. GitBook uses it to tailor the answer towards what is most useful for that goal.

The response will contain a direct answer to the question and relevant excerpts and sources from the documentation.

Use this mechanism when the answer is not explicitly present in the current page, you need clarification or additional context, or you want to retrieve related documentation sections.