> For the complete documentation index, see [llms.txt](https://docs.avonnicomponents.com/llms.txt). Markdown versions of documentation pages are available by appending `.md` to page URLs; this page is available as [Markdown](https://docs.avonnicomponents.com/flow/tutorials/components/data-table/group-rows-and-show-totals.md).

# Group rows and show totals

Group the rows of a screen flow Data Table by a field such as Stage, then add a subtotal per group and a grand total at the bottom of the table.

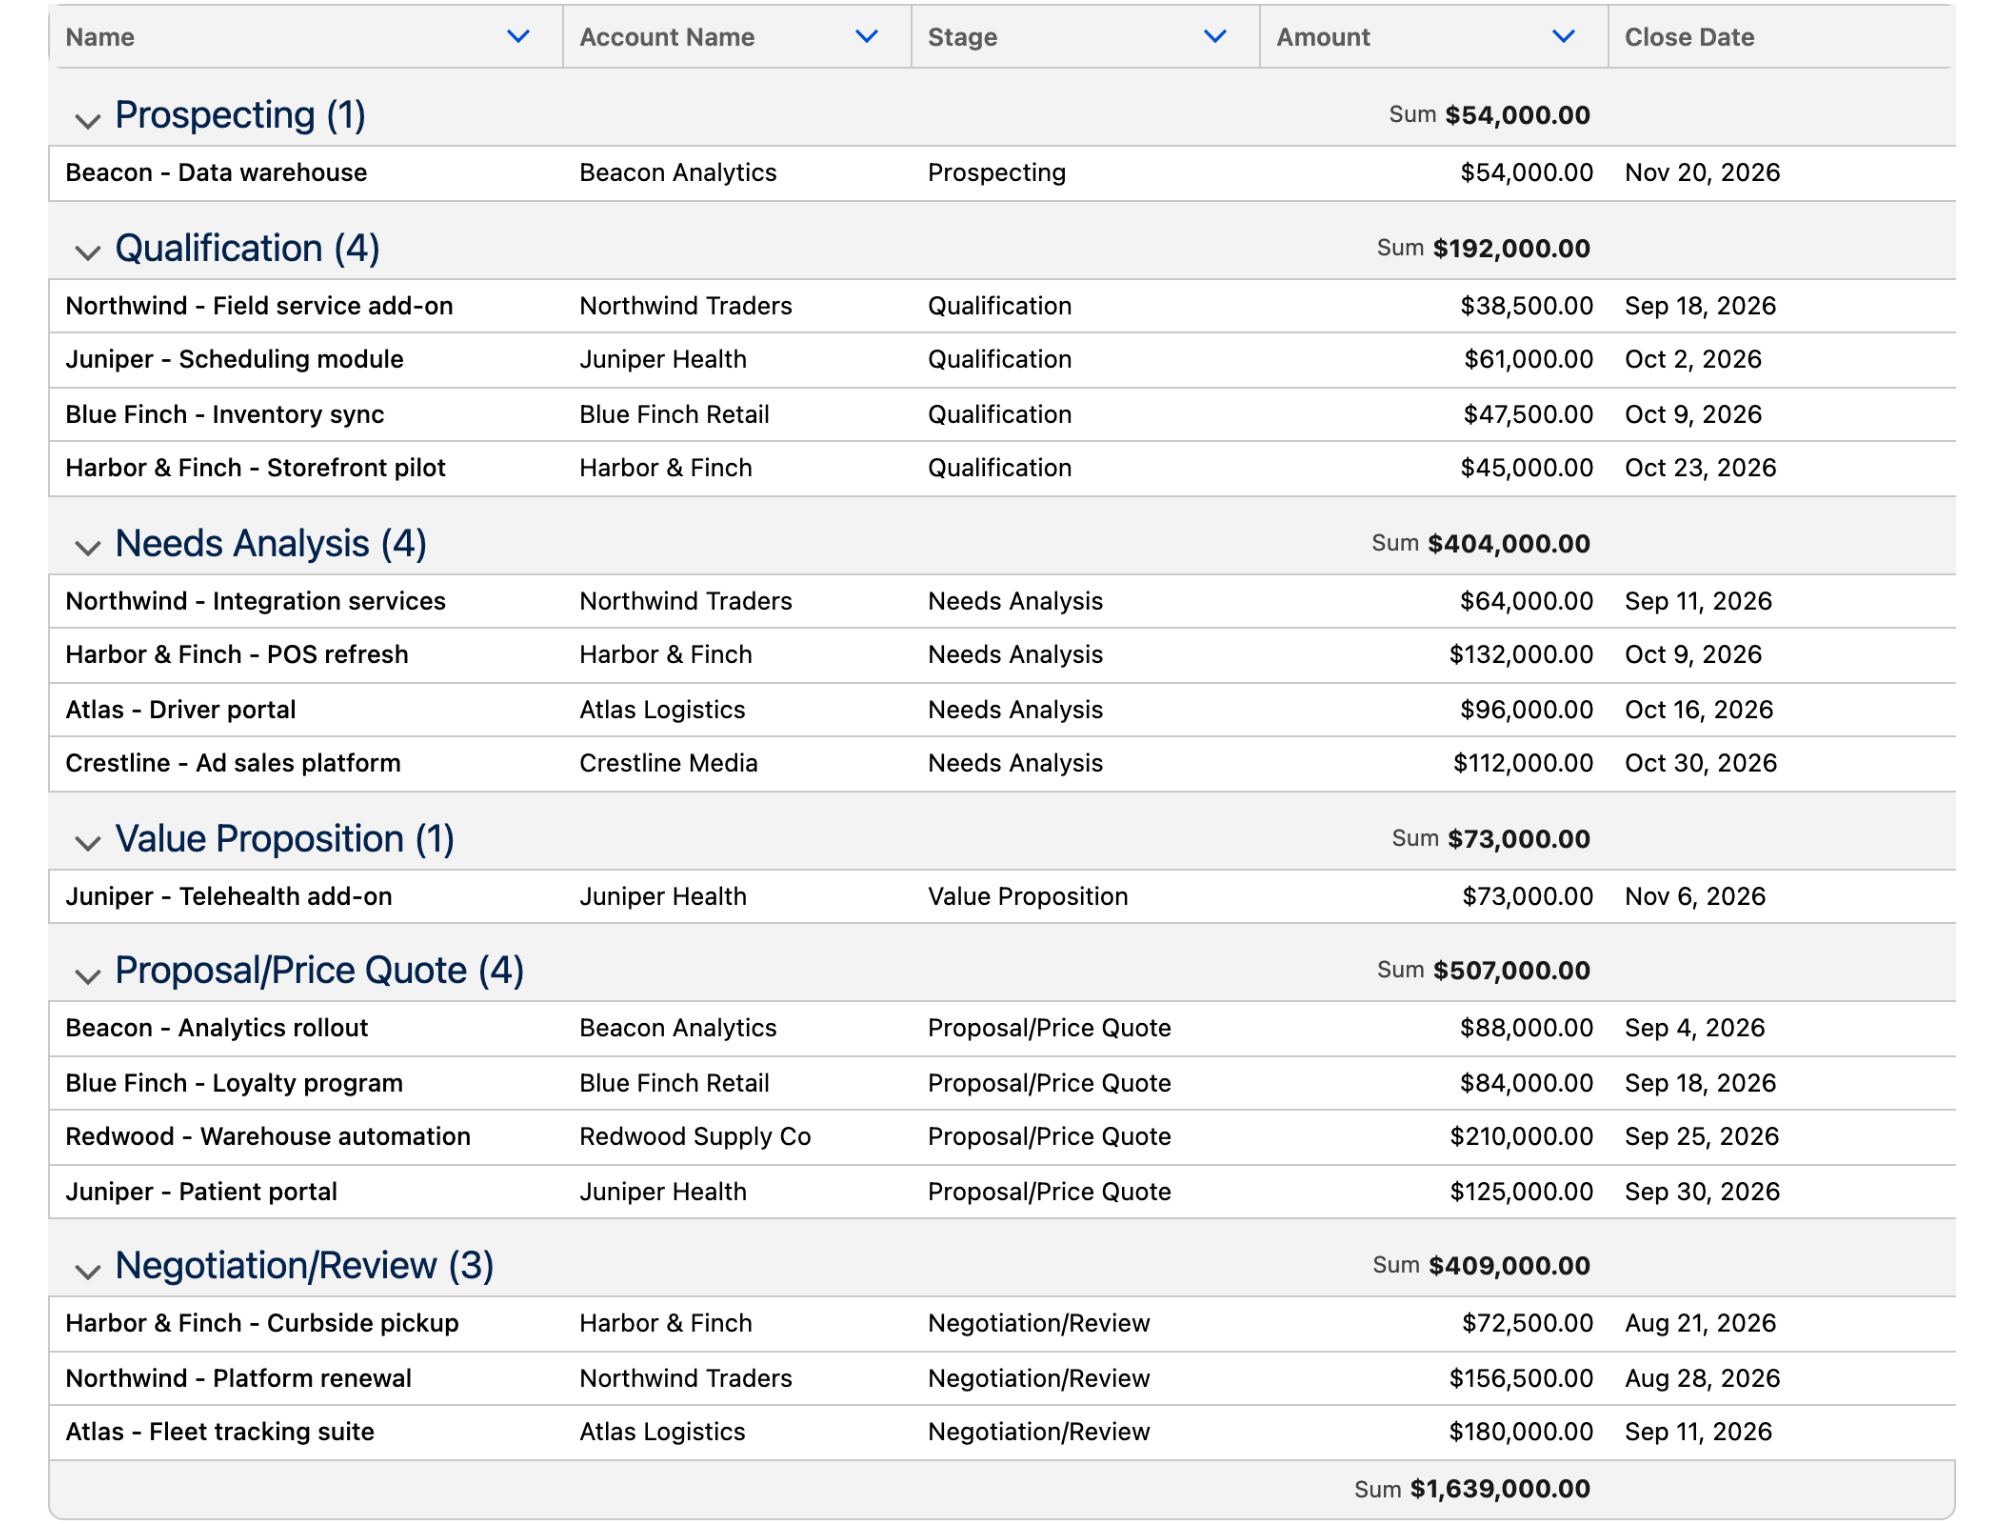
A sales manager opens a screen flow to review the open pipeline before the weekly forecast call. A flat list of forty deals hides the question that matters: how much money sits in each stage. Grouping the Data Table by **Stage** puts each stage in its own collapsible section, and a **Sum** on **Amount** gives a subtotal per stage plus a grand total for the whole pipeline.

<figure><img src="https://27923732-files.gitbook.io/~/files/v0/b/gitbook-x-prod.appspot.com/o/spaces%2F1FUd4apB9YHgCEMUFbVb%2Fuploads%2FQ196qFPGJMihMEQKnklJ%2Fdata-table-tutorial-group-rows-and-show-totals-result.png?alt=media" alt="A Data Table of open opportunities grouped by stage, each group showing its row count and a Sum subtotal of Amount, with a grand total row at the bottom"><figcaption><p>Open deals grouped by stage, with a subtotal per stage and a grand total.</p></figcaption></figure>

## Before you start

* A screen flow with the Avonni Data Table on a screen. If you have never set one up, start with [Learn the Basics](https://docs.avonnicomponents.com/flow/tutorials/components/data-table/learn-the-basics.md).
* A data source that returns open Opportunities with **Opportunity Name**, **Account Name**, **Stage**, **Amount** and **Close Date**. This page uses a **Query** data source. A Get Records collection (**Variable**) works too.
* The field you group by must be part of the rows the table receives. With a **Variable** data source, make sure your Get Records element stores it.

## Steps

{% stepper %}
{% step %}

### Load the open deals

1. Select the Data Table on your screen and click **Open Component Builder**.
2. In the **Properties** tab, under **Data Source**, choose **Query** and pick the **Opportunity** object.
3. Add a filter so only open deals load, for example **Closed** equals `False`.
4. Add the columns **Opportunity Name**, **Account Name**, **Stage**, **Amount** and **Close Date**.
   {% endstep %}

{% step %}

### Group the rows by Stage

1. Still in the **Properties** tab, open **Data Mappings**.
2. In **Group By**, select **Stage**.

The preview now shows one section per stage value. With a **Query** source the list only offers fields Salesforce can group on (a picklist like Stage, not a long text area). With a record collection, any field of the object is available.

<figure><img src="https://27923732-files.gitbook.io/~/files/v0/b/gitbook-x-prod.appspot.com/o/spaces%2F1FUd4apB9YHgCEMUFbVb%2Fuploads%2FoXCnFEgJeeCWZCXwTE0b%2Fdata-table-tutorial-group-rows-and-show-totals-group-by-panel.png?alt=media" alt="The Group By section of the Data Table Properties tab with Display Group Rows Count turned on and Direction set to Custom" width="320"><figcaption><p>The Group By section, with the stages in a custom order.</p></figcaption></figure>
{% endstep %}

{% step %}

### Put the stages in pipeline order

A forecast reads best when the sections follow the sales process.

1. Open the **Group By** section of the **Properties** tab.
2. Set **Direction** to **Custom**.
3. In **Group By Custom Order**, list the stages in the order you want: `Prospecting`, `Qualification`, `Needs Analysis`, `Value Proposition`, `Proposal/Price Quote`, `Negotiation/Review`.

{% hint style="warning" %}
A custom order is also a filter: a group whose value is not in the list is hidden. Add every value you expect, spelled exactly as it appears in the group headers.
{% endhint %}

**Ascending Order** and **Descending Order** sort the sections by their value instead. **Default** keeps the order of the data.
{% endstep %}

{% step %}

### Choose how the groups behave

In the same **Group By** section, two settings shape the forecast view:

* **Display Group Rows Count** shows the number of deals next to each stage. Turn it on.
* **Collapsed** opens the screen with every group closed, one line per stage. Leave it off here.

The other options (empty groups, the blank group, the grand total, links on lookup groups) are listed in the [Data Table reference](https://docs.avonnicomponents.com/flow/flow-components/data-table.md#group-by).
{% endstep %}

{% step %}

### Add a total on Amount

1. In the preview, click the chevron on the **Amount** column header and choose **Type Attributes**.
2. Make sure **Type** is **Currency**.
3. Set **Summarize By** to **Sum**.
4. Optional: turn on **Treat Blank Values As Zero** if a deal without an amount must count in an **Average** or a **Count**.

**Summarize By** exists on **Currency**, **Number** and **Percent** columns, with three choices: **Sum**, **Average** and **Count**. Without Group By, the same setting adds a single total row under the table.

<figure><img src="https://27923732-files.gitbook.io/~/files/v0/b/gitbook-x-prod.appspot.com/o/spaces%2F1FUd4apB9YHgCEMUFbVb%2Fuploads%2FNBHyVvpoRuKm6UIKDKz7%2Fdata-table-tutorial-group-rows-and-show-totals-summarize-by.png?alt=media" alt="Type Attributes of the Amount column scrolled to Summarize By set to Sum, with Treat Blank Values As Zero turned off" width="320"><figcaption><p>Summarize By on the Amount column adds the subtotals and the grand total.</p></figcaption></figure>
{% endstep %}

{% step %}

### Save and test

Click **Done**, save the flow and run it with **Debug** (or from the page that launches it).

You should see one section per stage, in your custom order, each header showing the stage, its row count and its subtotal (for example "Sum $192,000.00"), and a grand total row under the last stage. Selecting rows still works across groups: the table's **Selected Rows** output holds every checked deal when the user clicks **Next**.
{% endstep %}
{% endstepper %}

## Good to know

* With a **Query** data source, subtotals and the grand total are calculated over all the records that match the query, not only the rows loaded so far. They stay right with pagination or infinite scrolling.
* Blank amounts are skipped in an **Average** or a **Count**, unless **Treat Blank Values As Zero** is on.
* In a multi-currency org, the totals add the raw amounts without converting them. Filter the query on one currency (`CurrencyIsoCode`) before you sum Amounts in different currencies.

## Troubleshooting

<details>

<summary>The total row says "Sum" and I need another word</summary>

The row label is fixed: **Sum**, **Avg** or **Count**, in English, depending on the **Summarize By** choice. There is no setting to rename it today. If the label matters, rename the column instead, for example **Amount (total per stage)**.

</details>

<details>

<summary>Stage does not appear in the Group By list</summary>

With a **Variable** data source, the list offers the fields of the collection: check that your Get Records element stores **Stage**.

</details>

<details>

<summary>No subtotal appears</summary>

**Summarize By** only shows for **Currency**, **Number** and **Percent** columns. If **Amount** was added as **Text**, change its **Type** to **Currency** first.

</details>

## Related tutorials

* [Work with Selected Rows](https://docs.avonnicomponents.com/flow/tutorials/components/data-table/work-with-selected-rows.md): use the deals the manager ticked in the next element of the flow.
* [Activate infinite scrolling](https://docs.avonnicomponents.com/flow/tutorials/components/data-table/tips-and-tricks/activate-infinite-scrolling.md): load long lists in batches, the totals stay complete.
* [How to set column visibility](https://docs.avonnicomponents.com/flow/tutorials/components/data-table/tips-and-tricks/how-to-set-column-visibity.md): show or hide a column from a flow condition.


---

# Agent Instructions
This documentation is published with GitBook. GitBook is the documentation platform designed so that both humans and AI agents can read, navigate, and reason over technical content effectively. Learn more at gitbook.com.

## Querying This Documentation
If you need additional information that is not directly available in this page, you can query the documentation by asking a question.

Perform an HTTP GET request on the following URL with the `ask` and `goal` query parameters:

```
GET https://docs.avonnicomponents.com/flow/tutorials/components/data-table/group-rows-and-show-totals.md?ask=<question>&goal=<user_goal>
```

`ask` is the immediate question: it should be specific, self-contained, and written in natural language.
`goal` is what the user is ultimately trying to achieve, the reason they need the answer. Sharing it helps GitBook give you a better, more relevant answer. A goal is most helpful when it describes the outcome the user wants rather than restating the question. For example, with `ask=how do I create an API token`, a goal like `automate deployments from our CI pipeline` lets GitBook tailor the answer to that use case.

The response will contain a direct answer to the question and relevant excerpts and sources from the documentation.

Use this mechanism when the answer is not explicitly present in the current page, you need clarification or additional context, or you want to retrieve related documentation sections.
