> For the complete documentation index, see [llms.txt](https://docs.avonnicomponents.com/llms.txt). Markdown versions of documentation pages are available by appending `.md` to page URLs; this page is available as [Markdown](https://docs.avonnicomponents.com/flow/flow-components/map.md).

# Map

The Avonni Map shows a map of a specific place. It can help you get a sense of location or get directions.

***

## Tutorials

Learn the Map by building with it. The [Map tutorials](/flow/tutorials/components/map.md) follow one field sales team from colored pins to routes and drawn territories.

<table data-view="cards"><thead><tr><th></th><th></th><th data-hidden data-card-cover data-type="files"></th><th data-hidden data-card-target data-type="content-ref"></th></tr></thead><tbody><tr><td><strong>Customize the Map Marker</strong></td><td>Color each account's pin by its Rating so a field rep spots hot accounts at a glance, then try the other five marker shapes and your own SVG icon.</td><td><a href="https://27923732-files.gitbook.io/~/files/v0/b/gitbook-x-prod.appspot.com/o/spaces%2F1FUd4apB9YHgCEMUFbVb%2Fuploads%2FaIN450GNsTHpgErCxq8T%2Fmaptuto-card-customize-the-map-marker.png?alt=media">maptuto-card-customize-the-map-marker.png</a></td><td><a href="/flow/tutorials/components/map/customize-the-map-marker.md">Customize the Map Marker</a></td></tr><tr><td><strong>Create a Clickable Map with Account Details</strong></td><td>Build a screen where a rep clicks an account's pin and its details appear beside the map, then let the same click open a panel to log a visit.</td><td><a href="https://27923732-files.gitbook.io/~/files/v0/b/gitbook-x-prod.appspot.com/o/spaces%2F1FUd4apB9YHgCEMUFbVb%2Fuploads%2FBrlZBZvbfxnPLpp94RVu%2Fmaptuto-card-create-a-clickable-map-with-details-information.png?alt=media">maptuto-card-create-a-clickable-map-with-details-information.png</a></td><td><a href="/flow/tutorials/projects/create-a-clickable-map-with-details-information.md">Create a Clickable Map with Account Details</a></td></tr><tr><td><strong>Filter a Data Table or Map by the current record in a screen flow</strong></td><td>Show only the current record's Cases or Contacts in an Avonni Data Table or Map, with a recordId query filter in your screen flow.</td><td><a href="https://27923732-files.gitbook.io/~/files/v0/b/gitbook-x-prod.appspot.com/o/spaces%2F1FUd4apB9YHgCEMUFbVb%2Fuploads%2FoSb8luXRbb157dDEyngh%2Frecordid-cover-filter-a-data-table-or-map-by-the-current-record.png?alt=media">recordid-cover-filter-a-data-table-or-map-by-the-current-record.png</a></td><td><a href="/flow/tutorials/tips-and-tricks/filter-a-data-table-or-map-by-the-current-record.md">Filter a Data Table or Map by the current record in a screen flow</a></td></tr><tr><td><strong>Add Search and Filters to a Map</strong></td><td>Add a search bar and Industry and Rating filter menus to an Avonni Map, in a side panel, so reps find the right accounts among dozens of pins.</td><td><a href="https://27923732-files.gitbook.io/~/files/v0/b/gitbook-x-prod.appspot.com/o/spaces%2F1FUd4apB9YHgCEMUFbVb%2Fuploads%2FeOiskKVvJGb8mfp6LV12%2Fmaptuto-card-add-search-and-filters.png?alt=media">maptuto-card-add-search-and-filters.png</a></td><td><a href="/flow/tutorials/components/map/add-search-and-filters.md">Add Search and Filters to a Map</a></td></tr><tr><td><strong>Interactive Map Filtering</strong></td><td>Build a screen flow where four Avonni Metrics recount the accounts in view each time a rep pans or zooms the Avonni Map.</td><td><a href="https://27923732-files.gitbook.io/~/files/v0/b/gitbook-x-prod.appspot.com/o/spaces%2F1FUd4apB9YHgCEMUFbVb%2Fuploads%2F0CZPyynndM6fCbkjYrny%2Fmaptuto-card-interactive-map-filtering.png?alt=media">maptuto-card-interactive-map-filtering.png</a></td><td><a href="/flow/tutorials/projects/interactive-map-filtering.md">Interactive Map Filtering</a></td></tr><tr><td><strong>Drag a Pin to Update a Location</strong></td><td>Let a service dispatcher drag a misplaced customer site to its real entrance on the map, then save the new latitude and longitude with Update Records.</td><td><a href="https://27923732-files.gitbook.io/~/files/v0/b/gitbook-x-prod.appspot.com/o/spaces%2F1FUd4apB9YHgCEMUFbVb%2Fuploads%2Fq7eedWqX8mK33N2YD5Fz%2Fmaptuto-card-drag-a-pin-to-update-a-location.png?alt=media">maptuto-card-drag-a-pin-to-update-a-location.png</a></td><td><a href="/flow/tutorials/components/map/drag-a-pin-to-update-a-location.md">Drag a Pin to Update a Location</a></td></tr><tr><td><strong>Plan a Route from the Map</strong></td><td>Let a field rep pick tomorrow's accounts on an Avonni Map in a screen flow, optimize the stop order, calculate the route and start navigation.</td><td><a href="https://27923732-files.gitbook.io/~/files/v0/b/gitbook-x-prod.appspot.com/o/spaces%2F1FUd4apB9YHgCEMUFbVb%2Fuploads%2FXIGZSFWvNjotySHzPPdA%2Fmaptuto-card-plan-a-route.png?alt=media">maptuto-card-plan-a-route.png</a></td><td><a href="/flow/tutorials/components/map/plan-a-route.md">Plan a Route from the Map</a></td></tr><tr><td><strong>Draw a Territory and Save It to the Record</strong></td><td>Let a sales manager draw a territory on an Avonni Map in a screen flow, save it as a file on the account, and reopen it later to edit.</td><td><a href="https://27923732-files.gitbook.io/~/files/v0/b/gitbook-x-prod.appspot.com/o/spaces%2F1FUd4apB9YHgCEMUFbVb%2Fuploads%2FYOkO5W5Eec1lowJVaX4r%2Fmaptuto-card-draw-a-territory.png?alt=media">maptuto-card-draw-a-territory.png</a></td><td><a href="/flow/tutorials/components/map/draw-a-territory.md">Draw a Territory and Save It to the Record</a></td></tr></tbody></table>

Prefer video? [Build a no-code Salesforce map for instant account insights](https://youtu.be/4JgAJE3if-0) walks through a map screen flow (recorded in 2024, on the earlier builder).

***

## Overview

The Avonni Map displays interactive geographic data using Google Maps or Leaflet. It visualizes Salesforce records as markers on a configurable map, and supports route planning, marker clustering, drawing tools, GeoJSON overlays, and custom tile layers for advanced geospatial use cases.

### Map Type

Choose it first, with **Type** at the top of the **Properties** tab: everything else depends on it.

|                                             | Google Maps                | Leaflet                         |
| ------------------------------------------- | -------------------------- | ------------------------------- |
| **Best for**                                | Simple, address-based maps | Data-heavy or interactive maps  |
| **Marker limit**                            | 100 markers                | Unlimited                       |
| **Location input**                          | Street address             | Latitude + Longitude (required) |
| **Marker clustering**                       | ❌                          | ✅                               |
| **Draw shapes on map**                      | ❌                          | ✅                               |
| **Route planning**                          | ❌                          | ✅                               |
| **GeoJSON territories**                     | ❌                          | ✅                               |
| **Center and Visible Width follow panning** | ❌                          | ✅                               |
| **Several records at one address**          | ❌                          | ✅                               |

{% tabs %}
{% tab title="Google Maps" %}
Use it for street addresses and fewer than 100 locations. No data prep: map an address such as `123 Main St, New York` and it works.

> **Example:** A "Contact Us" page showing your 5 regional offices.

<figure><img src="https://27923732-files.gitbook.io/~/files/v0/b/gitbook-x-prod.appspot.com/o/spaces%2F1FUd4apB9YHgCEMUFbVb%2Fuploads%2Fneuo6mLDntEEhaWngagp%2Fmap-type-google.png?alt=media" alt="Five Chicago customer sites on Google Maps: four red pins near the lakeshore, from Edgewater in the north to just southwest of the Loop, and a blue circle over Hyde Park. The Map and Satellite buttons sit at the top left, the Street View and zoom controls on the right."><figcaption><p>Type set to Google Maps. The circle over Hyde Park shows that shape markers work on Google Maps too.</p></figcaption></figure>
{% endtab %}

{% tab title="Leaflet" %}
Use it for large datasets, drawn shapes, routes, or anything interactive. Every location needs **latitude and longitude**: Leaflet cannot geocode a street address, so geocode your records first if those fields are empty.

> **Example:** A field rep sees 800 accounts clustered by area, zooms into a city, and draws a polygon around a new prospect area.

{% hint style="warning" %}
Add `https://tile.openstreetmap.org` to **Setup > Trusted URLs** in your org, or the map shows a gray area instead of tiles.
{% endhint %}

<figure><img src="https://27923732-files.gitbook.io/~/files/v0/b/gitbook-x-prod.appspot.com/o/spaces%2F1FUd4apB9YHgCEMUFbVb%2Fuploads%2FEoHKlS4fP1heSvfnRDVj%2Fmap-type-leaflet.png?alt=media" alt="The same five Chicago customer sites on a Leaflet map with OpenStreetMap tiles: four red pins near the lakeshore and a blue circle over Hyde Park. The popup of the northern pin is open and reads Northwind Traders, Andersonville office. Zoom buttons sit at the bottom right."><figcaption><p>Type set to Leaflet, on the same records. Clicking a marker opens its popup.</p></figcaption></figure>
{% endtab %}
{% endtabs %}

***

{% hint style="info" %}
**See it in a real project**

[Site survey inside a flow](https://docs.avonnicomponents.com/projects/use-cases/inside-a-flow/site-survey-inside-a-flow): A roof traced on a live map inside a flow, saved as a file.
{% endhint %}

## Leaflet-Only Features

Available only when **Type** is **Leaflet**.

### Marker Interaction

Three settings in the first group of the **Properties** tab.

| Setting                         | What it does                                                                                                                                 |
| ------------------------------- | -------------------------------------------------------------------------------------------------------------------------------------------- |
| **Draggable Markers**           | End users drag markers. Wire **Marker Drag** to save the new coordinates                                                                     |
| **Disable Auto Pan Markers**    | No panning when a marker is dragged near the map edge. Requires **Draggable Markers**                                                        |
| **Enable Multi-Select Markers** | Ctrl (or Cmd) + click selects several markers; a click on the map background or Escape clears them. Returned in **Selected Markers SObject** |

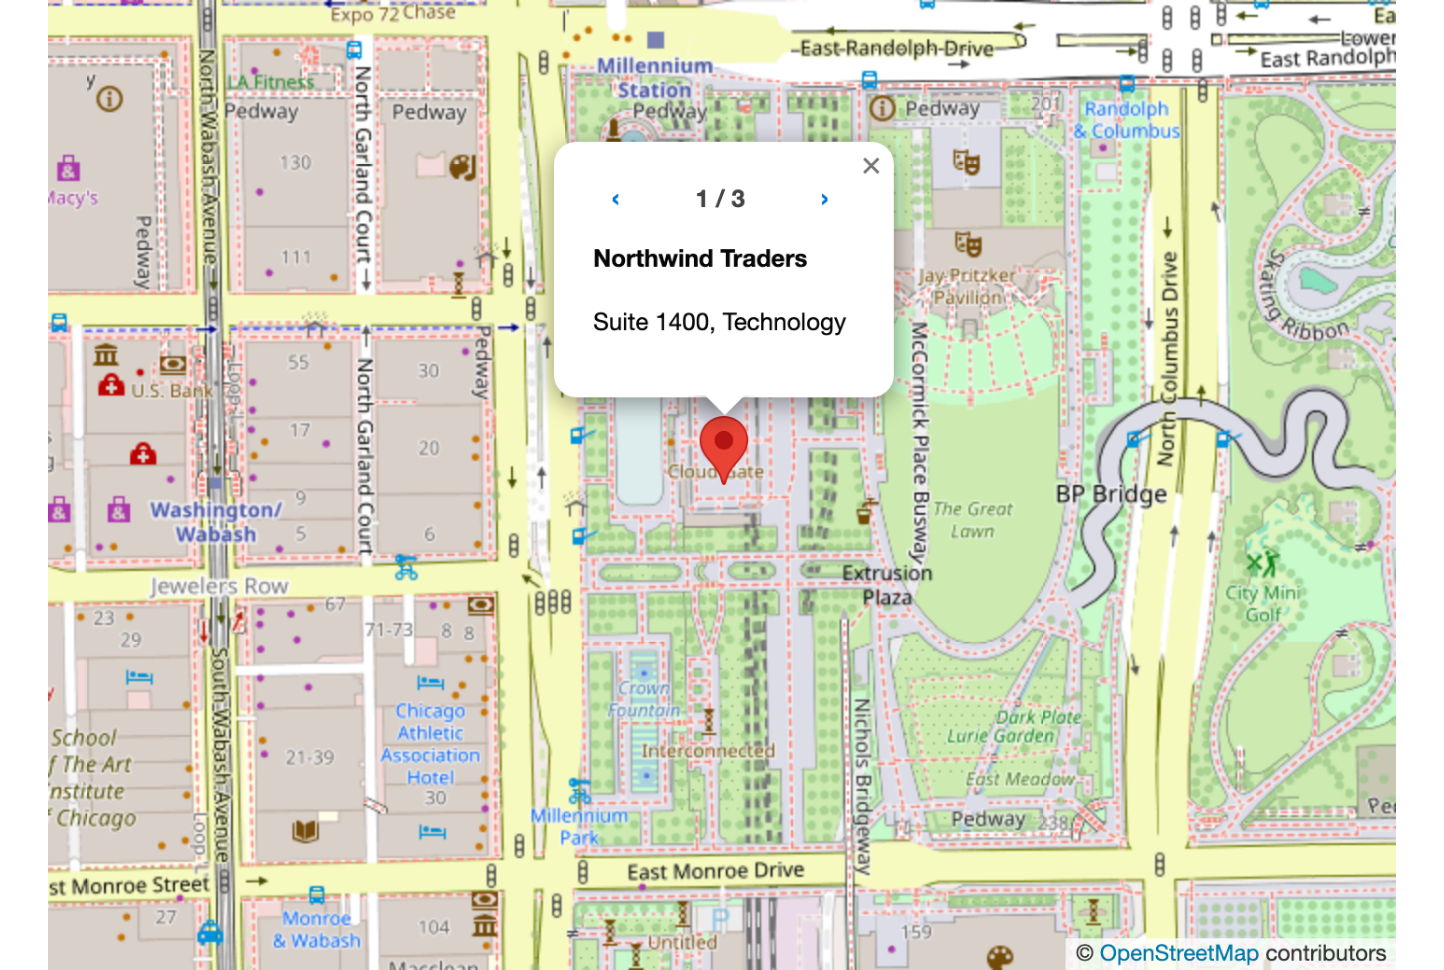
### Several Records at One Address

Records with exactly the same latitude and longitude share one marker. Its popup pages through them with arrows and a counter, so no record's real location has to change.

<figure><img src="https://27923732-files.gitbook.io/~/files/v0/b/gitbook-x-prod.appspot.com/o/spaces%2F1FUd4apB9YHgCEMUFbVb%2Fuploads%2FDwmD5ymLG0cUhq7ZwWzW%2Fmap-same-address.png?alt=media" alt="A map marker popup showing the first of three records, with arrows and a 1 / 3 counter"><figcaption><p>Three tenants registered at one address, all reachable from a single marker.</p></figcaption></figure>

| Rule                               | Detail                                                                                |
| ---------------------------------- | ------------------------------------------------------------------------------------- |
| **Point markers only**             | Circle, Rectangle and Polygon markers always stay separate                            |
| **A Title is required**            | A record with no **Title** mapped is not offered as a page in the popup               |
| **Coordinates must match exactly** | Records a few metres apart stay separate markers: use **Marker Clustering** for those |

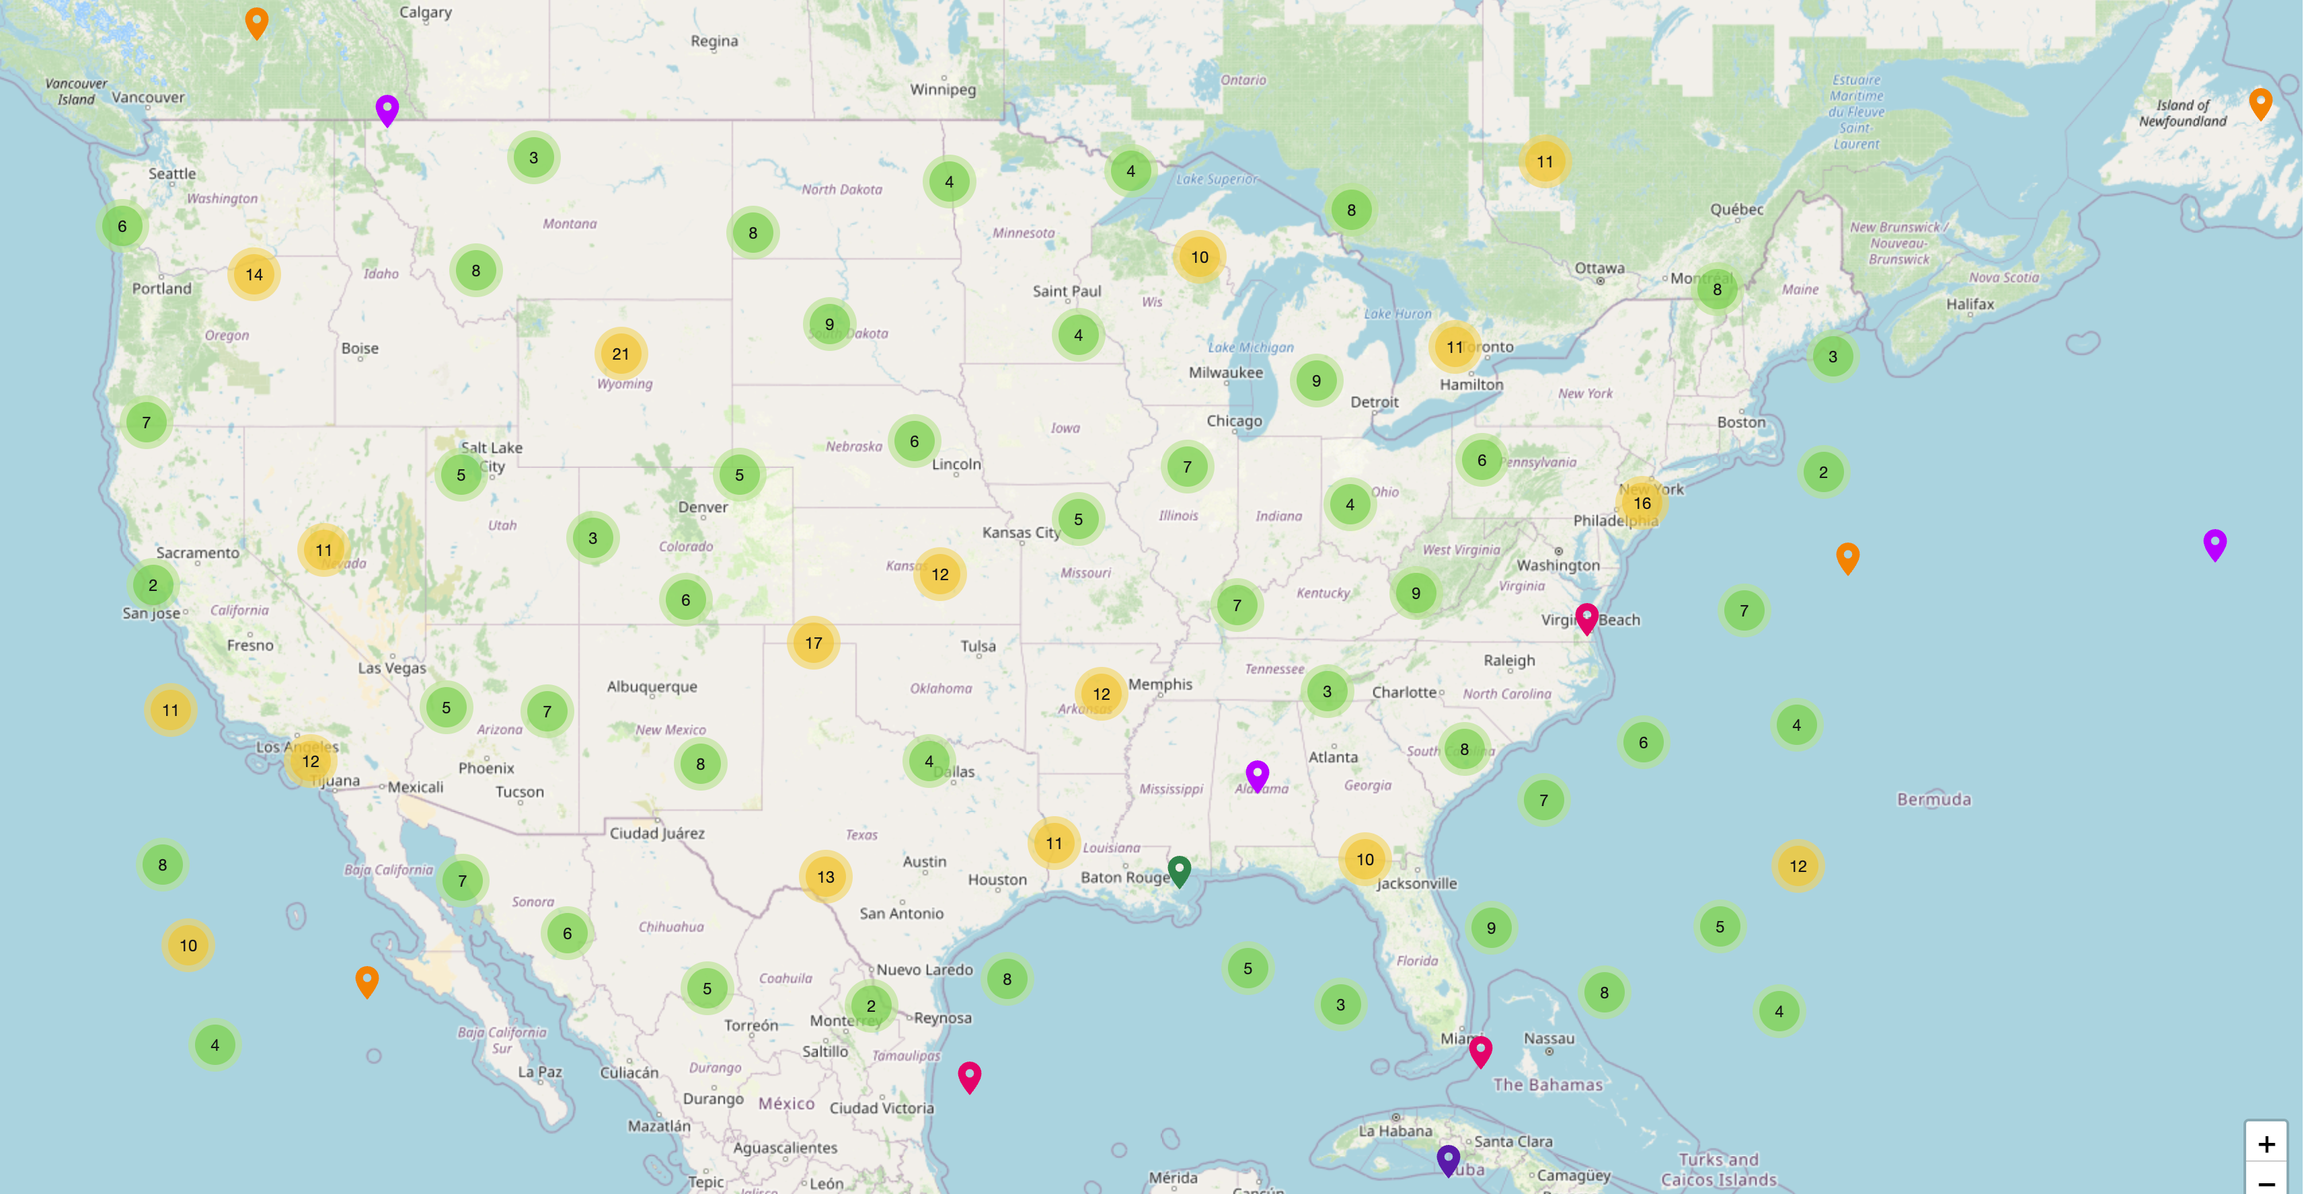
### Marker Clustering

Groups nearby pins into a numbered circle ("50" means 50 records there) that splits into smaller clusters, then single pins, as end users zoom in. Turn on **Enable Marker Clustering** in the **Marker Clustering** group.

> **Example:** 600 customer accounts show as 4 or 5 regional clusters; zooming into a city reveals each account.

<figure><img src="https://27923732-files.gitbook.io/~/files/v0/b/gitbook-x-prod.appspot.com/o/spaces%2F1FUd4apB9YHgCEMUFbVb%2Fuploads%2Fgit-blob-44ec172b4331e31672ebac73ddeba10b7ab0fa02%2Fimage%20(17).webp?alt=media" alt=""><figcaption></figcaption></figure>

### Clustering Settings

| Setting                           | What it does                                                                            |
| --------------------------------- | --------------------------------------------------------------------------------------- |
| **Coverage On Hover**             | Hovering a cluster shows the area it covers                                             |
| **Max Cluster Radius**            | Pixels from a pin before it joins a cluster. Default 80. Higher: fewer, larger clusters |
| **Disable Clustering Zoom Level** | At this zoom level and closer, every pin shows on its own                               |

### Route Planning

End users build a multi-stop driving route from the markers on the map, then open each stop in a navigation app or export the itinerary.

<figure><img src="https://27923732-files.gitbook.io/~/files/v0/b/gitbook-x-prod.appspot.com/o/spaces%2F1FUd4apB9YHgCEMUFbVb%2Fuploads%2FO3f8AGOVOr2viTJggU6y%2Frouting-route-panel.png?alt=media" alt="A map of Chicago with five numbered stops joined by a driving route. The Route panel on the right lists the five stops in order with an arrival time for each stop after the first, and shows the departure and arrival times, the total duration, and the Optimize and Clear actions."><figcaption><p>Once routing is enabled, the Route panel turns the stops picked on a map into a driving route. With Mapbox, it also shows when each stop is reached.</p></figcaption></figure>

An administrator enables routing once per package, with your own routing provider API key: see [Enable Map Routing](/flow/flow-components/map/enable-map-routing.md).

<figure><img src="https://27923732-files.gitbook.io/~/files/v0/b/gitbook-x-prod.appspot.com/o/spaces%2F1FUd4apB9YHgCEMUFbVb%2Fuploads%2FNV46NNDFZvVvnm1uzVRf%2Fmap-builder-routing-notice.png?alt=media" alt="The Route group of the Map&#x27;s Properties tab, opened between Marker Clustering and Draw. Instead of settings it shows a warning: Enable routing in App Launcher → Avonni app → Settings to configure map routes." width="320"><figcaption><p>Until routing is enabled in the Avonni app Settings, the Route group shows this notice instead of its settings.</p></figcaption></figure>

| Setting                          | What it does                                                                                                             | Requires             |
| -------------------------------- | ------------------------------------------------------------------------------------------------------------------------ | -------------------- |
| **Show Route Panel**             | **Route** button (route icon) among the header actions; opens the Route panel                                            | Routing enabled      |
| **Disable Multi-Stop Selection** | Turns off **Add Multiple Stops** (area select): stops are added one marker at a time                                     | **Show Route Panel** |
| **Position**                     | Side the panel opens on: **Right** (default) or **Left**                                                                 | **Show Route Panel** |
| **Display Overlaid on the Map**  | Panel over the map instead of beside it; the **Route** button moves onto the map, except on a narrow map such as a phone | **Show Route Panel** |
| **Opened by Default**            | Panel open when the map loads                                                                                            | **Show Route Panel** |

<figure><img src="https://27923732-files.gitbook.io/~/files/v0/b/gitbook-x-prod.appspot.com/o/spaces%2F1FUd4apB9YHgCEMUFbVb%2Fuploads%2Fa5afOptdezqktlDl9S5F%2Fmap-route-beside.png?alt=media" alt="A Leaflet map titled Customer visits with the Route panel as a column on its right, outside the map. In the header, the Route button is selected. Five numbered stops in Chicago are joined by straight lines in the order of the list, and the panel lists them under Starting point, with Settings and the Calculate route button below."><figcaption><p>When the Route panel is not overlaid on the map, it opens as a column beside it, and the Route button in the header shows or hides it. The route is not calculated yet, so the stops are joined by straight lines.</p></figcaption></figure>

**How end users build a route**

{% stepper %}
{% step %}

#### **Add stops**

Click markers, or click **Add Multiple Stops** and draw a rectangle or lasso around several. Up to 25 stops.

<figure><img src="https://27923732-files.gitbook.io/~/files/v0/b/gitbook-x-prod.appspot.com/o/spaces%2F1FUd4apB9YHgCEMUFbVb%2Fuploads%2FncCpDayjChLlwNzUkPda%2Fmap-route-multi-stop.png?alt=media" alt="Part of a Leaflet map with the Route panel open. At the top of the map, Add Multiple Stops has opened into two buttons, a rectangle tool, selected, and a lasso tool. Two stops, Atlas Logistics and Blue Finch Retail, are numbered 1 and 2 on the map and listed in the panel above Settings and Calculate route. Three markers not yet in the route are still red pins."><figcaption><p>Add Multiple Stops opens a rectangle tool and a lasso tool. Drawing a shape on the map adds every marker inside it to the route.</p></figcaption></figure>
{% endstep %}

{% step %}

#### **Set a starting point**

Search any record on the map, or choose **My position** for the browser's location.
{% endstep %}

{% step %}

#### **Reorder**

Drag the stops into visiting order. **Undo**, **Redo** and **Clear** sit in the panel header.
{% endstep %}

{% step %}

#### **Optimize**

Reorders the stops for the shortest driving time. The first stop, or the starting point when one is set, stays in place.

<details>

<summary>How Optimize orders the stops</summary>

On Mapbox, the routing provider works out the order, unless an administrator turned that off in [Enable Map Routing](/flow/flow-components/map/enable-map-routing.md). On other providers, for routes over twelve stops, and when it is turned off, the stops are ordered by proximity instead.

</details>
{% endstep %}

{% step %}

#### **Calculate route**

Draws the road geometry and fills in each stop's distance and drive time from the previous one.
{% endstep %}
{% endstepper %}

> **Example:** A field rep opens a flow showing today's 12 accounts, clicks the six to visit, drags them into order, calculates the route, and opens the first stop in Waze.

### Route Settings

The end user sets these in the **Settings** section of the Route panel. Nothing to configure in the Component Builder.

<figure><img src="https://27923732-files.gitbook.io/~/files/v0/b/gitbook-x-prod.appspot.com/o/spaces%2F1FUd4apB9YHgCEMUFbVb%2Fuploads%2F9YaYtY3Y9HrRUzOPVE67%2Fmap-route-settings.png?alt=media" alt="The Route panel with its Settings section open. Lunch start 12:00 p.m., Lunch end 1:00 p.m., End of day 6:00 p.m., Visit duration (minutes) 30, Timing set to Leave at, Date Nov 14, 2026, Time 8:00 a.m., then three switches, Avoid ferries, Avoid highways and Avoid tolls, all off. The Calculate route button sits at the bottom of the panel." width="320"><figcaption><p>The Settings section of the Route panel. Timing is set to Leave at, which shows the Date and Time fields; apart from the date, every value is the default.</p></figcaption></figure>

{% hint style="info" %}
**Mapbox only:** **Timing**, the departure and arrival times, and the CSV's **Arrival Time** column. Mapbox is the only provider that models traffic, so the only one where a departure time changes the result.
{% endhint %}

| Setting                                                | What it does                                                                                                                                                                       |
| ------------------------------------------------------ | ---------------------------------------------------------------------------------------------------------------------------------------------------------------------------------- |
| **Timing**                                             | **Leave now**, **Leave at** or **Arrive by**; the last two add a **Date** and **Time**                                                                                             |
| **Visit duration (minutes)**                           | Time at each stop; delays every later stop (ten stops carry eight visits: the first and last delay nothing). Default 30                                                            |
| **Lunch start**, **Lunch end**                         | A route under way when the window starts pauses for all of it, driving or at a stop; later stops shift. A route leaving after the start takes no break. Default 12:00 to 1:00 p.m. |
| **End of day**                                         | Last time on the road; later stops are flagged after calculation. Default 6:00 p.m.                                                                                                |
| **Avoid ferries**, **Avoid highways**, **Avoid tolls** | Kept out of the calculated route and of the Google Maps links                                                                                                                      |

#### After the Route Is Calculated

The panel shows departure, arrival and total duration, plus each stop's arrival time. Visits and lunch are included, so the total is the length of the day, not the drive alone.

<figure><img src="https://27923732-files.gitbook.io/~/files/v0/b/gitbook-x-prod.appspot.com/o/spaces%2F1FUd4apB9YHgCEMUFbVb%2Fuploads%2F1atE6T1NsK4xcCkJWmGv%2Fmap-route-end-of-day.png?alt=media" alt="A Leaflet map titled Customer visits with five numbered stops in Chicago and the calculated driving route. The Route panel on the right reads 11:00 AM to 3:08 PM, 4 hr 8 min, followed by a red note: This route finishes after the end of day. Remove a stop, or start earlier. Stops 1 to 4 are blue and show their arrival times. Stop 5, Juniper Health, is orange, arrives at 3:08 PM and is flagged Past end of day, and the last leg of the route, from stop 4 to stop 5, is drawn in orange."><figcaption><p>A route that runs past the end of day: the late stop and the drive to it turn orange, its row is flagged Past end of day, and a note at the top of the panel says the route finishes too late.</p></figcaption></figure>

Nothing is dropped from a late route: removing a stop or starting earlier is the end user's call. If the provider cannot be reached or the quota is spent, the stops are joined by straight lines and the panel says why; the stop order still reads correctly.

### Navigation and CSV Export

A stop opens in **Google Maps** or **Waze** with guidance started and that stop as the sole destination. Google Maps links keep the **Avoid** settings; Waze takes no route preferences. The download saves `route_<date>.csv`.

<figure><img src="https://27923732-files.gitbook.io/~/files/v0/b/gitbook-x-prod.appspot.com/o/spaces%2F1FUd4apB9YHgCEMUFbVb%2Fuploads%2FoaxcVUcQcQBtAwtrTeSv%2Fmap-route-stop-menu.png?alt=media" alt="The Route panel after a five-stop route is calculated: 8:00 AM to 10:49 AM, 2 hr 49 min, then the Starting point search and the five stops with their arrival times. The menu of stop 2, Blue Finch Retail, is open on three actions: Remove, Google Maps and Waze. At the bottom, the Calculate route button is greyed out and a download button sits beside it." width="320"><figcaption><p>Each stop has its own menu: remove the stop from the route, or open it in Google Maps or Waze. Once a route is calculated, the download button beside Calculate route exports it as a CSV file.</p></figcaption></figure>

<details>

<summary>CSV columns, and why stops open one at a time</summary>

| Column             | What it holds                                                                    |
| ------------------ | -------------------------------------------------------------------------------- |
| **Stop Number**    | Visiting order. The starting point is 0; the remaining stops are numbered from 1 |
| **Record Name**    | The marker's title                                                               |
| **City**           | The stop's city, when the marker has one                                         |
| **Arrival Time**   | Only when the provider supplied arrival times                                    |
| **Distance (km)**  | Distance from the previous stop                                                  |
| **Duration (min)** | Drive time from the previous stop                                                |
| **Google Maps**    | Navigation link for that stop                                                    |
| **Waze**           | Navigation link for that stop                                                    |

The two link columns make the file a tap-through itinerary. CSV has no hyperlink format, so whether the links are tappable depends on the app that opens the file. In locales that write decimals with a comma, the file is semicolon-separated so it still opens as columns.

There is no single link for the whole route: a directions URL carries at most nine waypoints, and three on a mobile browser, so handing stops over one at a time is the only approach that works on every device.

</details>

### Drawing & Annotations

End users draw on the map and can save the drawings to a record as a Salesforce File.

> **Example:** A manager draws a polygon around a new sales zone, and it saves automatically to the related Opportunity.

{% stepper %}
{% step %}

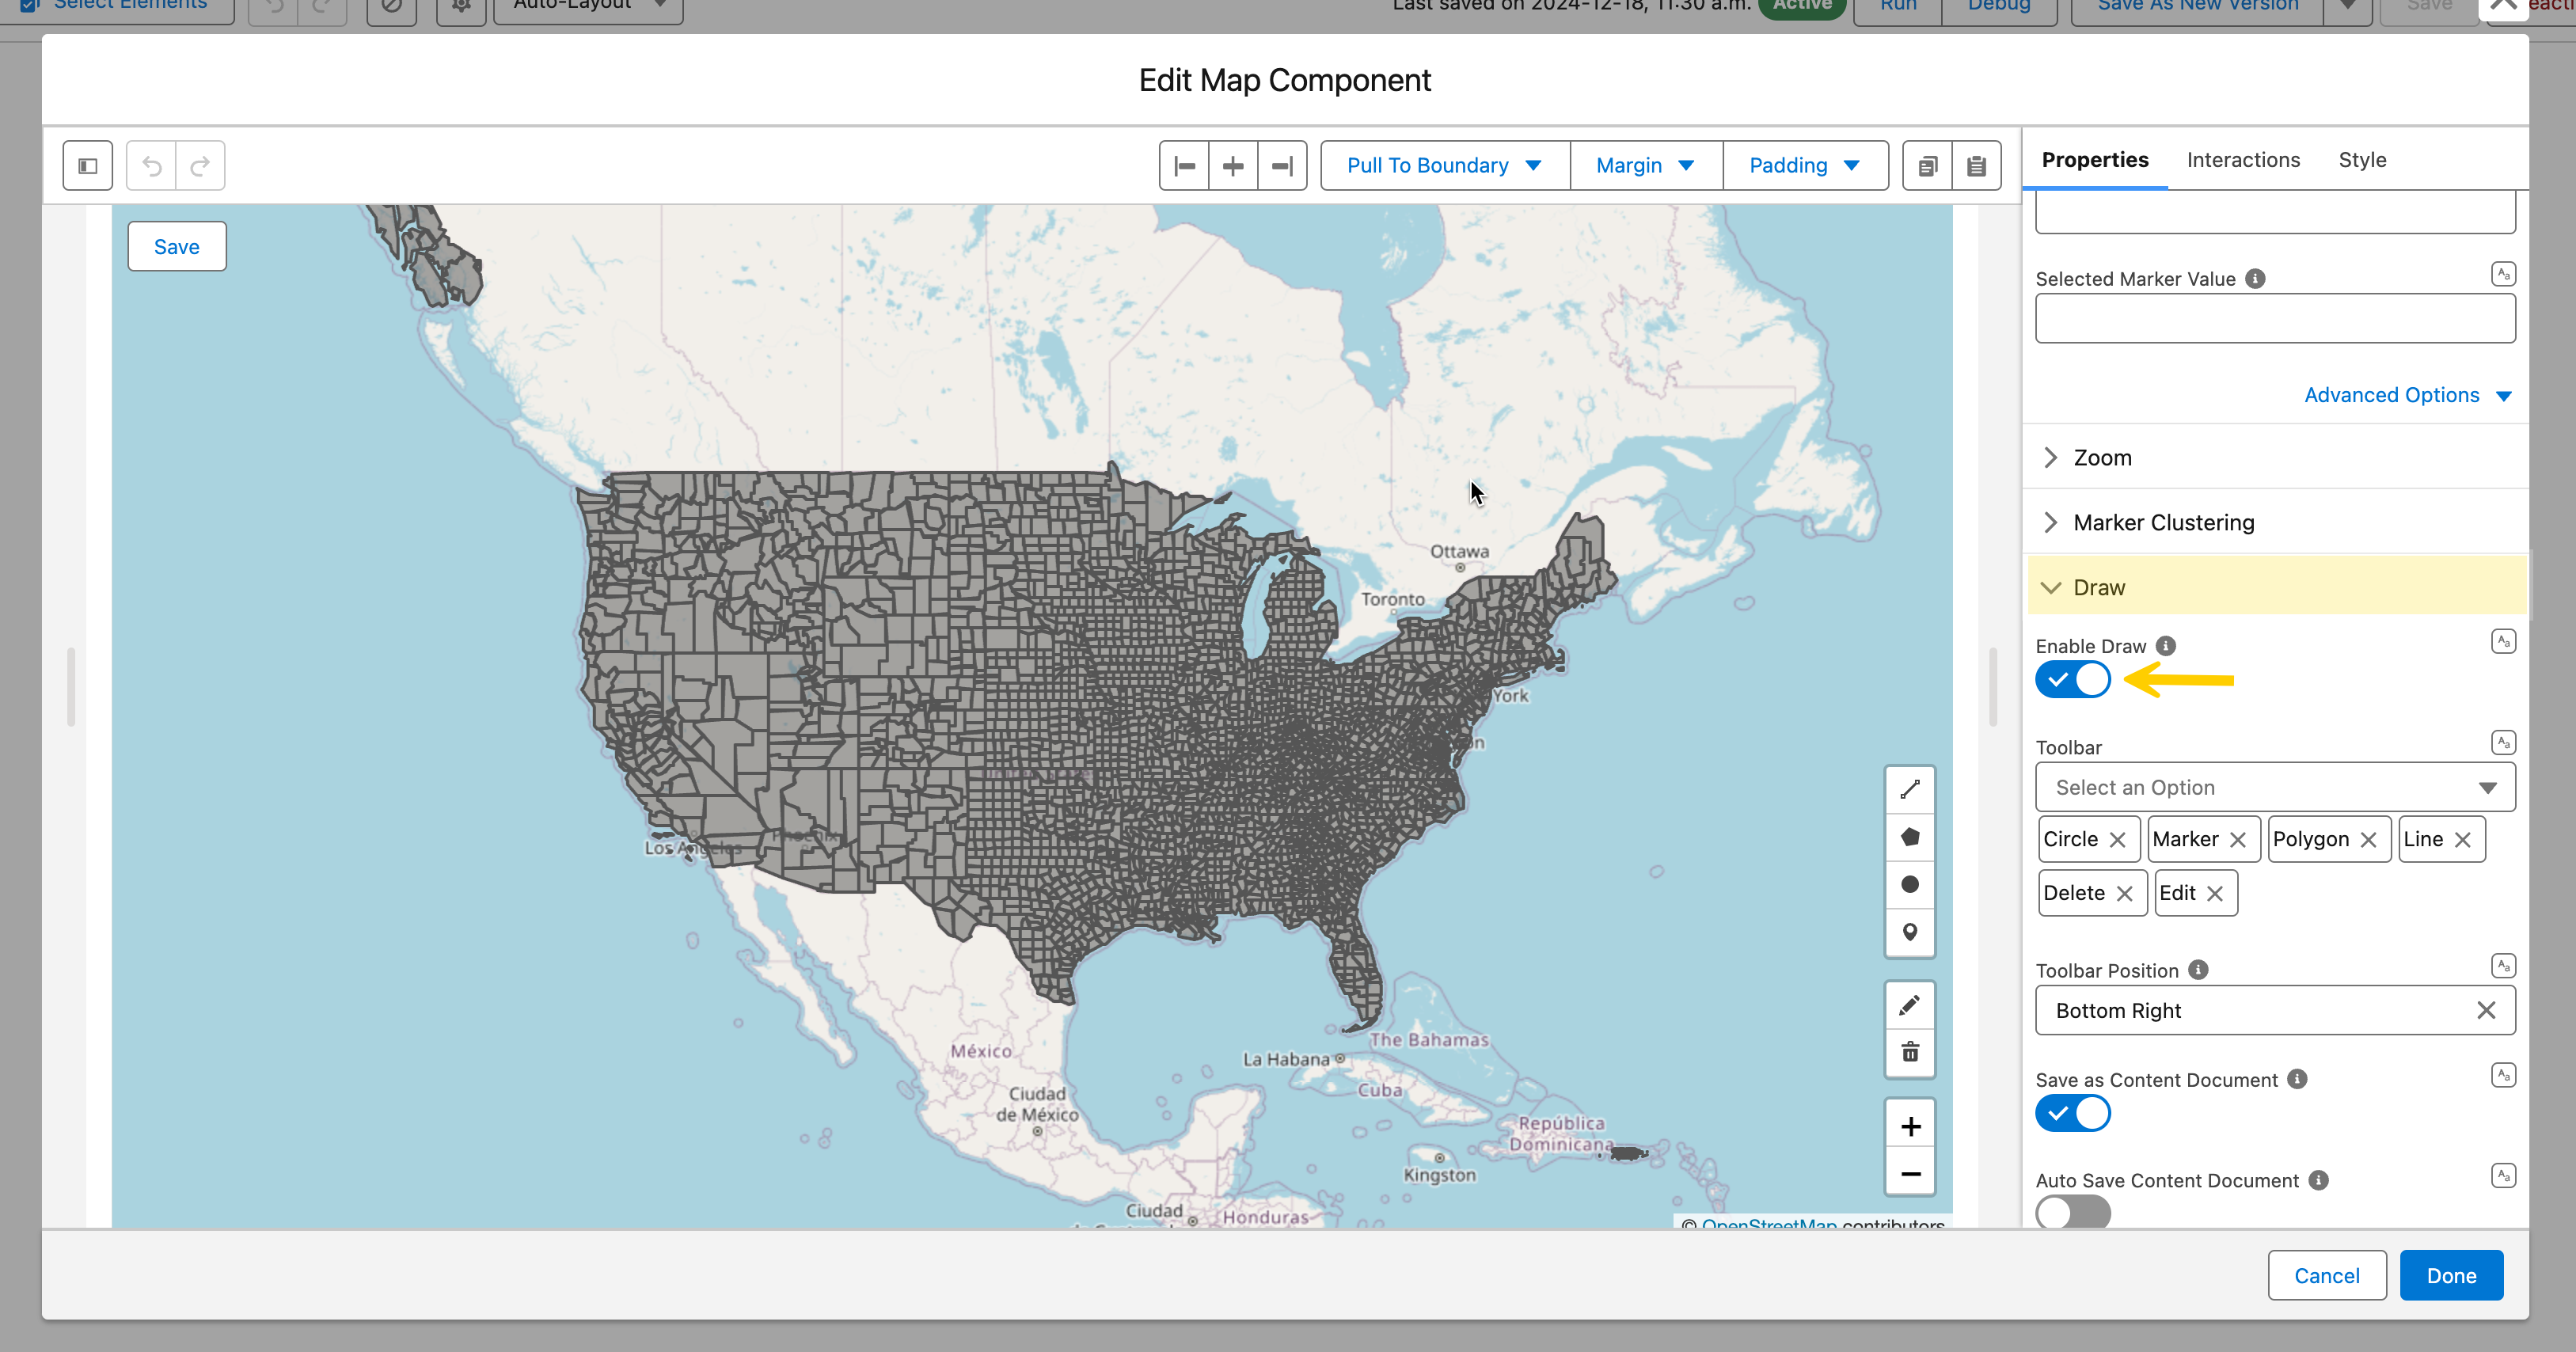
#### **Turn on Enable Draw**

In the **Draw** group of the **Properties** tab. The drawing toolbar appears on the map.

<figure><img src="https://27923732-files.gitbook.io/~/files/v0/b/gitbook-x-prod.appspot.com/o/spaces%2F1FUd4apB9YHgCEMUFbVb%2Fuploads%2Fgit-blob-b6568d943cf381aaab2955b1a7dd730d8d324a9e%2F2024-12-18_13-32-03.png?alt=media" alt=""><figcaption></figcaption></figure>
{% endstep %}

{% step %}

#### **Choose the tools**

**Toolbar** picks them (all shown by default). **Toolbar Position**: **Top Left**, **Top Right**, **Bottom Left** or **Bottom Right** (default).

| Tool           | Use it to                                           |
| -------------- | --------------------------------------------------- |
| 📍 **Marker**  | Pin a specific address or point of interest         |
| ➖ **Line**     | Show a route, path, or connection between locations |
| ▨ **Polygon**  | Outline a territory, service area, or neighborhood  |
| ⭕ **Circle**   | Define a delivery radius or zone of influence       |
| ✏️ **Edit**    | Resize or reposition existing shapes                |
| 🗑️ **Delete** | Remove unwanted drawings                            |
| {% endstep %}  |                                                     |

{% step %}

#### **Save the drawings to a record**

Turn on **Save as Content Document**; the settings below appear with it.

| Setting                               | What it does                                                                                          |
| ------------------------------------- | ----------------------------------------------------------------------------------------------------- |
| **Content Document Linked Entity Id** | Record the file is linked to, typically `{!recordId}`                                                 |
| **Auto Save Content Document**        | Optional. Saves changes without a manual save step                                                    |
| **Content Document Id**               | Optional. An existing file to load instead of creating a new one                                      |
| **Content Document Title**            | Optional. File name. Default "Avonni Map Drawing Document". Example: `Map Drawings - {!Account.Name}` |
| **Save Button Label**                 | Optional. Default "Save"                                                                              |
| {% endstep %}                         |                                                                                                       |
| {% endstepper %}                      |                                                                                                       |

### GeoJSON: Territories & Custom Boundaries

Overlay custom shapes such as county lines, sales territories or zip code boundaries.

{% tabs %}
{% tab title="Static (read-only)" %}
Set **GeoJSON Value**, in the first group of the **Properties** tab, to a GeoJSON object, an array of them, or the **Content Document Id** of a `.geojson` file in Salesforce Files (best for large datasets, 12MB max). End users can't edit the shapes.

> **Example:** A rep sees their assigned region as a shaded polygon they can't modify.

<figure><img src="https://27923732-files.gitbook.io/~/files/v0/b/gitbook-x-prod.appspot.com/o/spaces%2F1FUd4apB9YHgCEMUFbVb%2Fuploads%2FlEAqxD3ptWBMldbhlvGt%2Fmap-geojson.png?alt=media" alt="A Leaflet map of Chicago with three adjoining territories loaded from GeoJSON: North in blue, Central in orange and South in green, each with a colored outline and a light fill of the same color. Five red markers sit inside the territories."><figcaption><p>Static GeoJSON territories on a Leaflet map, each colored by the fill and stroke properties of its own feature.</p></figcaption></figure>
{% endtab %}

{% tab title="Editable" %}
Turn on **Enable Draw** first: the starting shapes load only while it is on. End users can then move, resize, add or delete them.

| Start from                                                     | Shown when                          | Edits are kept in                                                                               |
| -------------------------------------------------------------- | ----------------------------------- | ----------------------------------------------------------------------------------------------- |
| **Draw GeoJSON Value**: a GeoJSON object or an array of them   | **Save as Content Document** is off | The **Draw GeoJSON Value** output only: save it after the screen with an Update Records element |
| **Content Document Id**: a Salesforce File holding the GeoJSON | **Save as Content Document** is on  | That file                                                                                       |

> **Example:** A customer success manager loads a key account's territory, adjusts the boundary to a new agreement, and saves it back to the record.
> {% endtab %}
> {% endtabs %}

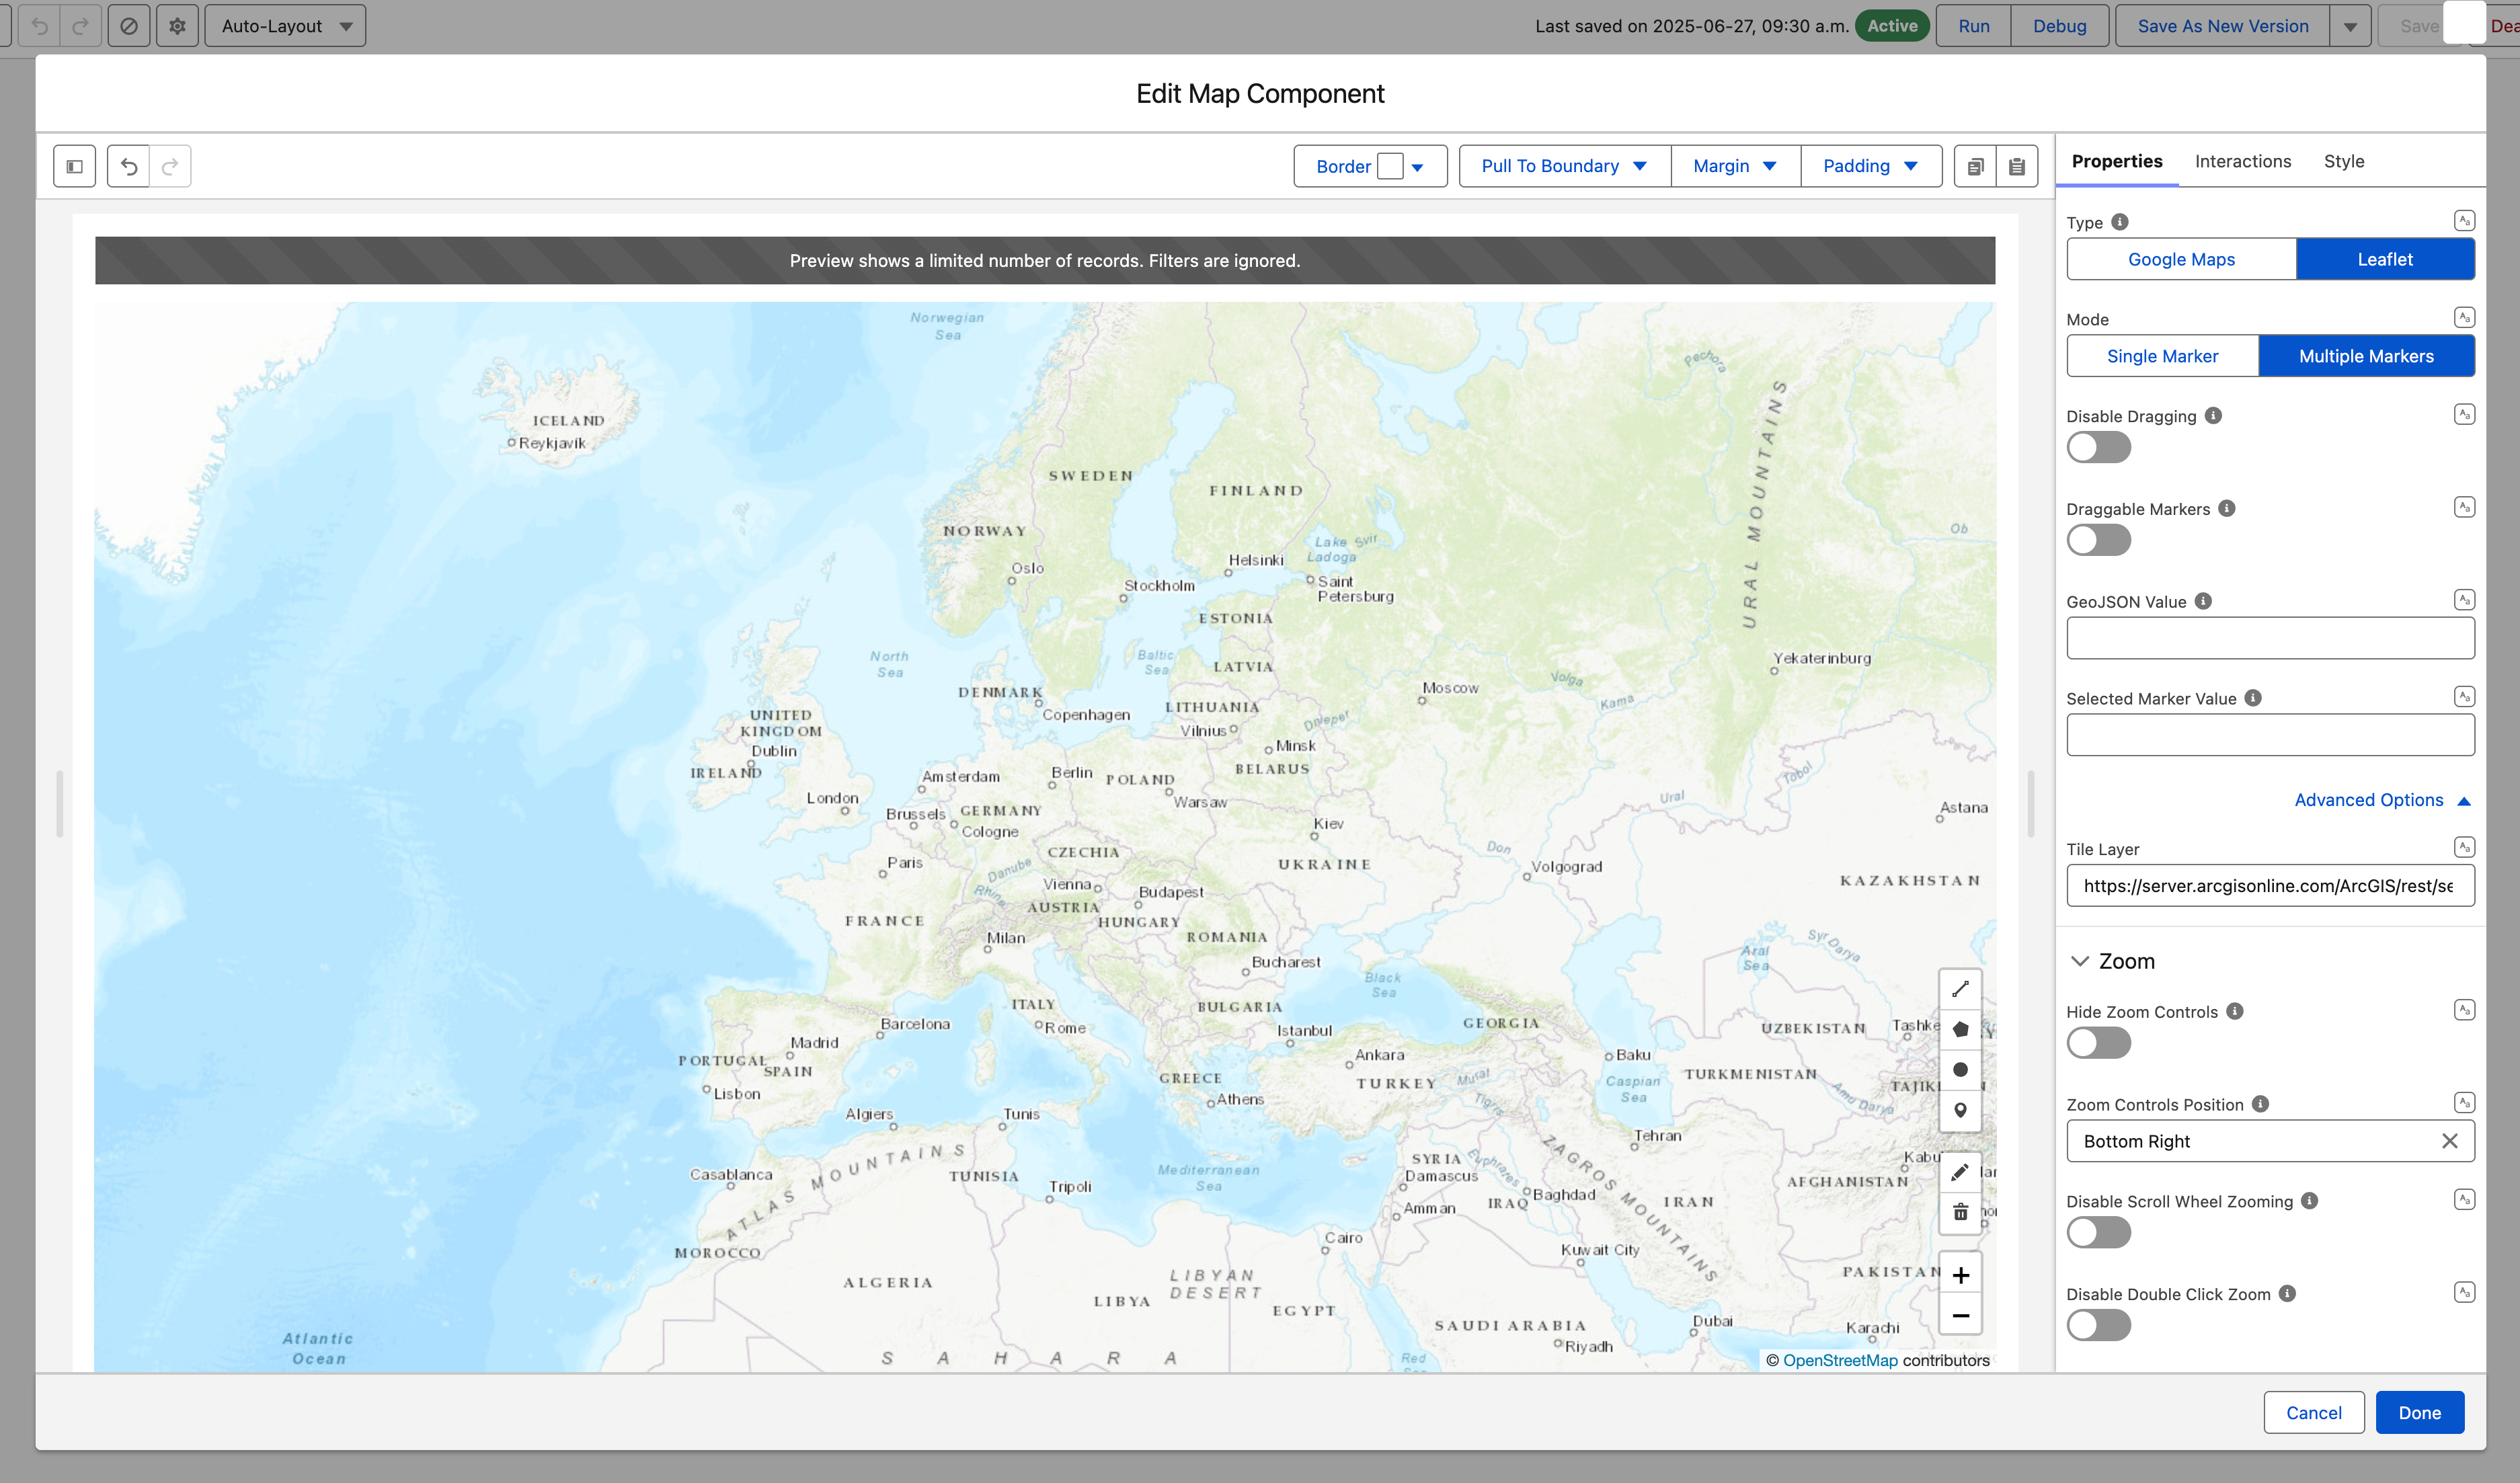
### Custom Tile Layer (Basemap Style)

Swap the default OpenStreetMap tiles for any Leaflet-compatible tile server: brand styling, satellite imagery, dark mode, terrain. In the **Properties** tab, open **Advanced Options** and set **Tile Layer** to a URL template with `{z}`, `{x}`, `{y}` placeholders. Google Maps tiles cannot be replaced.

<figure><img src="https://27923732-files.gitbook.io/~/files/v0/b/gitbook-x-prod.appspot.com/o/spaces%2F1FUd4apB9YHgCEMUFbVb%2Fuploads%2Fgit-blob-9d4f99303dcec00f5af955e8554cc66419ce30d0%2F2026-04-30_14-03-46.png?alt=media" alt=""><figcaption></figcaption></figure>

<details>

<summary>Common tile layer URLs</summary>

| Style                              | URL template                                                                                    | Best for                            |
| ---------------------------------- | ----------------------------------------------------------------------------------------------- | ----------------------------------- |
| **OpenStreetMap** *(default)*      | `https://tile.openstreetmap.org/{z}/{x}/{y}.png`                                                | General-purpose maps                |
| **Carto Positron** (clean light)   | `https://{s}.basemaps.cartocdn.com/light_all/{z}/{x}/{y}.png`                                   | Dashboards, data viz                |
| **Carto Dark Matter** (dark)       | `https://{s}.basemaps.cartocdn.com/dark_all/{z}/{x}/{y}.png`                                    | Analytics dashboards, dark themes   |
| **Esri World Imagery** (satellite) | `https://server.arcgisonline.com/ArcGIS/rest/services/World_Imagery/MapServer/tile/{z}/{y}/{x}` | Field ops, real estate, agriculture |
| **OpenTopoMap** (terrain)          | `https://a.tile.opentopomap.org/{z}/{x}/{y}.png`                                                | Outdoor, rural logistics            |

> **Example:** A logistics dashboard uses Carto Dark Matter tiles so colored pins and clusters stand out against a low-contrast background.

</details>

{% hint style="warning" %}
Some tile providers (Mapbox, MapTiler, Stadia Maps) need an API key in the URL and enforce usage limits. The default OpenStreetMap server suits prototyping, not production traffic: review each provider's terms before going live.
{% endhint %}

***

## Configuration

Select the Map on the Flow screen, then click **Open Component Builder**.

<figure><img src="https://27923732-files.gitbook.io/~/files/v0/b/gitbook-x-prod.appspot.com/o/spaces%2F1FUd4apB9YHgCEMUFbVb%2Fuploads%2FzyMla74eCUKn1pMQUSIw%2Fmap-editor-dialog.png?alt=media" alt="The Edit Map Component dialog in Flow Builder. On the left, a toolbar with Border, Pull To Boundary, Margin and Padding above a preview of a Leaflet map titled Customer sites, with a search box, Industry and Account Type filter menus, and the banner Preview does not include data. On the right, the Properties, Interactions and Style tabs, with Type set to Leaflet and Mode set to Multiple Markers. Cancel and Done sit at the bottom."><figcaption><p>The Edit Map Component dialog: a preview on the left, the Properties, Interactions and Style tabs on the right.</p></figcaption></figure>

Below, **Data Source** and **Data Mapping** come first, then the other **Properties** groups in panel order, then Marker Customization. **Type** is covered in Map Type, and **Marker Clustering**, **Route** and **Draw** in Leaflet-Only Features.

### Data Source

**Mode** picks the source. **Single Marker** places one marker whose location you enter or map in the first group (an address or coordinates on Google Maps, latitude and longitude on Leaflet), with an optional **Marker Title**, **Marker Description** and **Type**. **Multiple Markers** (default) reads a data source:

<table><thead><tr><th width="130.611328125">Option</th><th>What it does</th><th>When to use</th></tr></thead><tbody><tr><td><a href="/flow/component-builder/data-sources/manual.md"><strong>Manual</strong></a></td><td>Enter coordinates directly in the component</td><td>Fixed locations that never change</td></tr><tr><td><a href="/flow/component-builder/data-sources/variable.md"><strong>Variable</strong></a></td><td>Connect to a Flow variable</td><td>Locations that change as the flow runs</td></tr><tr><td><a href="/flow/component-builder/data-sources/query.md"><strong>Query</strong></a></td><td>Pull from a Salesforce object or custom query</td><td>Large datasets, complex filters, or record-driven maps</td></tr></tbody></table>

<figure><img src="https://27923732-files.gitbook.io/~/files/v0/b/gitbook-x-prod.appspot.com/o/spaces%2F1FUd4apB9YHgCEMUFbVb%2Fuploads%2FxsxeiyltpRdKjzbE520O%2Fmap-builder-data-source.png?alt=media" alt="Data Source section of the Map&#x27;s Properties tab with Query selected among Manual, Variable and Query. Object API Name is Account, the query Filters box is empty with Add Condition and Add Group, Order By sorts on Account Name ascending, and Maximum Number of Records is 50." width="320"><figcaption><p>Data Source set to Query: the object, optional query filters, a sort order and a record limit.</p></figcaption></figure>

{% hint style="success" %}
**Tip**

For most "show all records on a map" use cases, use **Query** and point it at your object (Accounts, Contacts, custom objects, etc.)
{% endhint %}

### Data Mapping

Map Salesforce fields to the marker. **Location** is the minimum: it places the pins.

<figure><img src="https://27923732-files.gitbook.io/~/files/v0/b/gitbook-x-prod.appspot.com/o/spaces%2F1FUd4apB9YHgCEMUFbVb%2Fuploads%2FDcLlMcUqcMwyWKa8FnbK%2Fmap-builder-data-mapping.png?alt=media" alt="Data Mappings section for a Leaflet map reading Account records. Title maps to Account Name, Description to the Industry field, Type is Default, Image maps to Photo URL, Infos holds one item named Visit website, Fields lists Industry and Employees, Location maps Latitude, Longitude and City to the billing fields, and Value maps to Id." width="320"><figcaption><p>Leaflet data mappings: the marker's title and description, the popup's Image, Infos and Fields, then Location and Value.</p></figcaption></figure>

| Mapping                        | What it sets                                                                                  | Map type    |
| ------------------------------ | --------------------------------------------------------------------------------------------- | ----------- |
| **Title**                      | Marker title, in the popup and the Route panel                                                | Both        |
| **Description**                | Text under the title                                                                          | Both        |
| **Type**                       | Marker shape: see Marker Customization                                                        | Both        |
| **Image**                      | Image across the top of the popup, from a URL                                                 | Leaflet     |
| **Infos**                      | Popup links: **Label**, **URL**, **Target** (**Self**, **Blank**, **Parent**, **Top**)        | Leaflet     |
| **Fields**                     | Label and value rows in the popup                                                             | Leaflet     |
| **Location**                   | **Latitude** and **Longitude** (required); optional **City** for the route stop list and file | Leaflet     |
| **Location**                   | Address fields, or **Latitude** and **Longitude**                                             | Google Maps |
| **Value**                      | Returned in **Selected Marker Value**. Default: the record Id                                 | Both        |
| **Filters**, **Search Fields** | Fields for the filter menus and the search bar                                                | Both        |

<figure><img src="https://27923732-files.gitbook.io/~/files/v0/b/gitbook-x-prod.appspot.com/o/spaces%2F1FUd4apB9YHgCEMUFbVb%2Fuploads%2FnsqkAOMf3WY3BCYZOBx0%2Fmap-popup.png?alt=media" alt="A Leaflet map titled Customer visits with the popup of Juniper Health open above its marker. The popup shows an illustration across its top, the title Juniper Health, the description Hyde Park clinic, a Visit website link, the fields Industry, Healthcare and Employees, 240, and an Add Stop button. A route button sits at the top right of the map."><figcaption><p>A marker popup on a Leaflet map. The image, the link and the fields come from the data mapping, and the Add Stop button appears when routing is on.</p></figcaption></figure>

### Properties

The first group of the **Properties** tab, under **Type** and **Mode**. On Leaflet it also holds the Marker Interaction settings, **GeoJSON Value** and, in **Advanced Options**, **Tile Layer**.

| Setting                   | What it does                                                                                             | Shown when                                         |
| ------------------------- | -------------------------------------------------------------------------------------------------------- | -------------------------------------------------- |
| **Disable Dragging**      | End users can't pan the map                                                                              | Always                                             |
| **Selected Marker Value** | Marker selected when the map loads, by its value                                                         | **Multiple Markers**                               |
| **List View**             | List of locations beside the map: **Auto** (default, only with several markers), **Visible**, **Hidden** | Google Maps, **Multiple Markers**                  |
| **List Title**            | Title above the list                                                                                     | Google Maps, **List View** **Auto** or **Visible** |
| **Disable Default UI**    | Hides the default map buttons, such as Map and Satellite                                                 | Google Maps                                        |
| **Show Footer**           | Footer below the map                                                                                     | Google Maps                                        |

<figure><img src="https://27923732-files.gitbook.io/~/files/v0/b/gitbook-x-prod.appspot.com/o/spaces%2F1FUd4apB9YHgCEMUFbVb%2Fuploads%2FkRNFYvN4OQtdNuLn2vjl%2Fmap-list-view.png?alt=media" alt="A Google map of Chicago with five red pins and, on its right, a list titled Customer Sites (5). Each entry has a green location icon, the site name as a link and its address: Atlas Logistics, 300 W Adams St, Chicago, IL; Blue Finch Retail, 2200 N Clark St; Northwind Traders, 5300 N Clark St; Redwood Supply Co, 1800 S Halsted St; Juniper Health, 1500 E 53rd St."><figcaption><p>List View set to Visible on a Google map. Each entry in the list shows the marker title and its address.</p></figcaption></figure>

### Zoom

| Setting                          | What it does                                                                                                              | Shown when                          |
| -------------------------------- | ------------------------------------------------------------------------------------------------------------------------- | ----------------------------------- |
| **Hide Zoom Controls**           | Hides the zoom buttons                                                                                                    | Always                              |
| **Zoom Controls Position**       | **Top Left**, **Top Right**, **Bottom Left**, **Bottom Right** (default)                                                  | Leaflet, **Hide Zoom Controls** off |
| **Disable Scroll Wheel Zooming** | No zoom on the mouse wheel                                                                                                | **Disable Dragging** off            |
| **Disable Double Click Zoom**    | No zoom on double click                                                                                                   | **Disable Dragging** off            |
| **Zoom Level**                   | Initial zoom, 0 to 22 on desktop, 0 to 20 on mobile: 1 the world, 5 a continent, 10 a city, 15 street level, 20 buildings | Always                              |

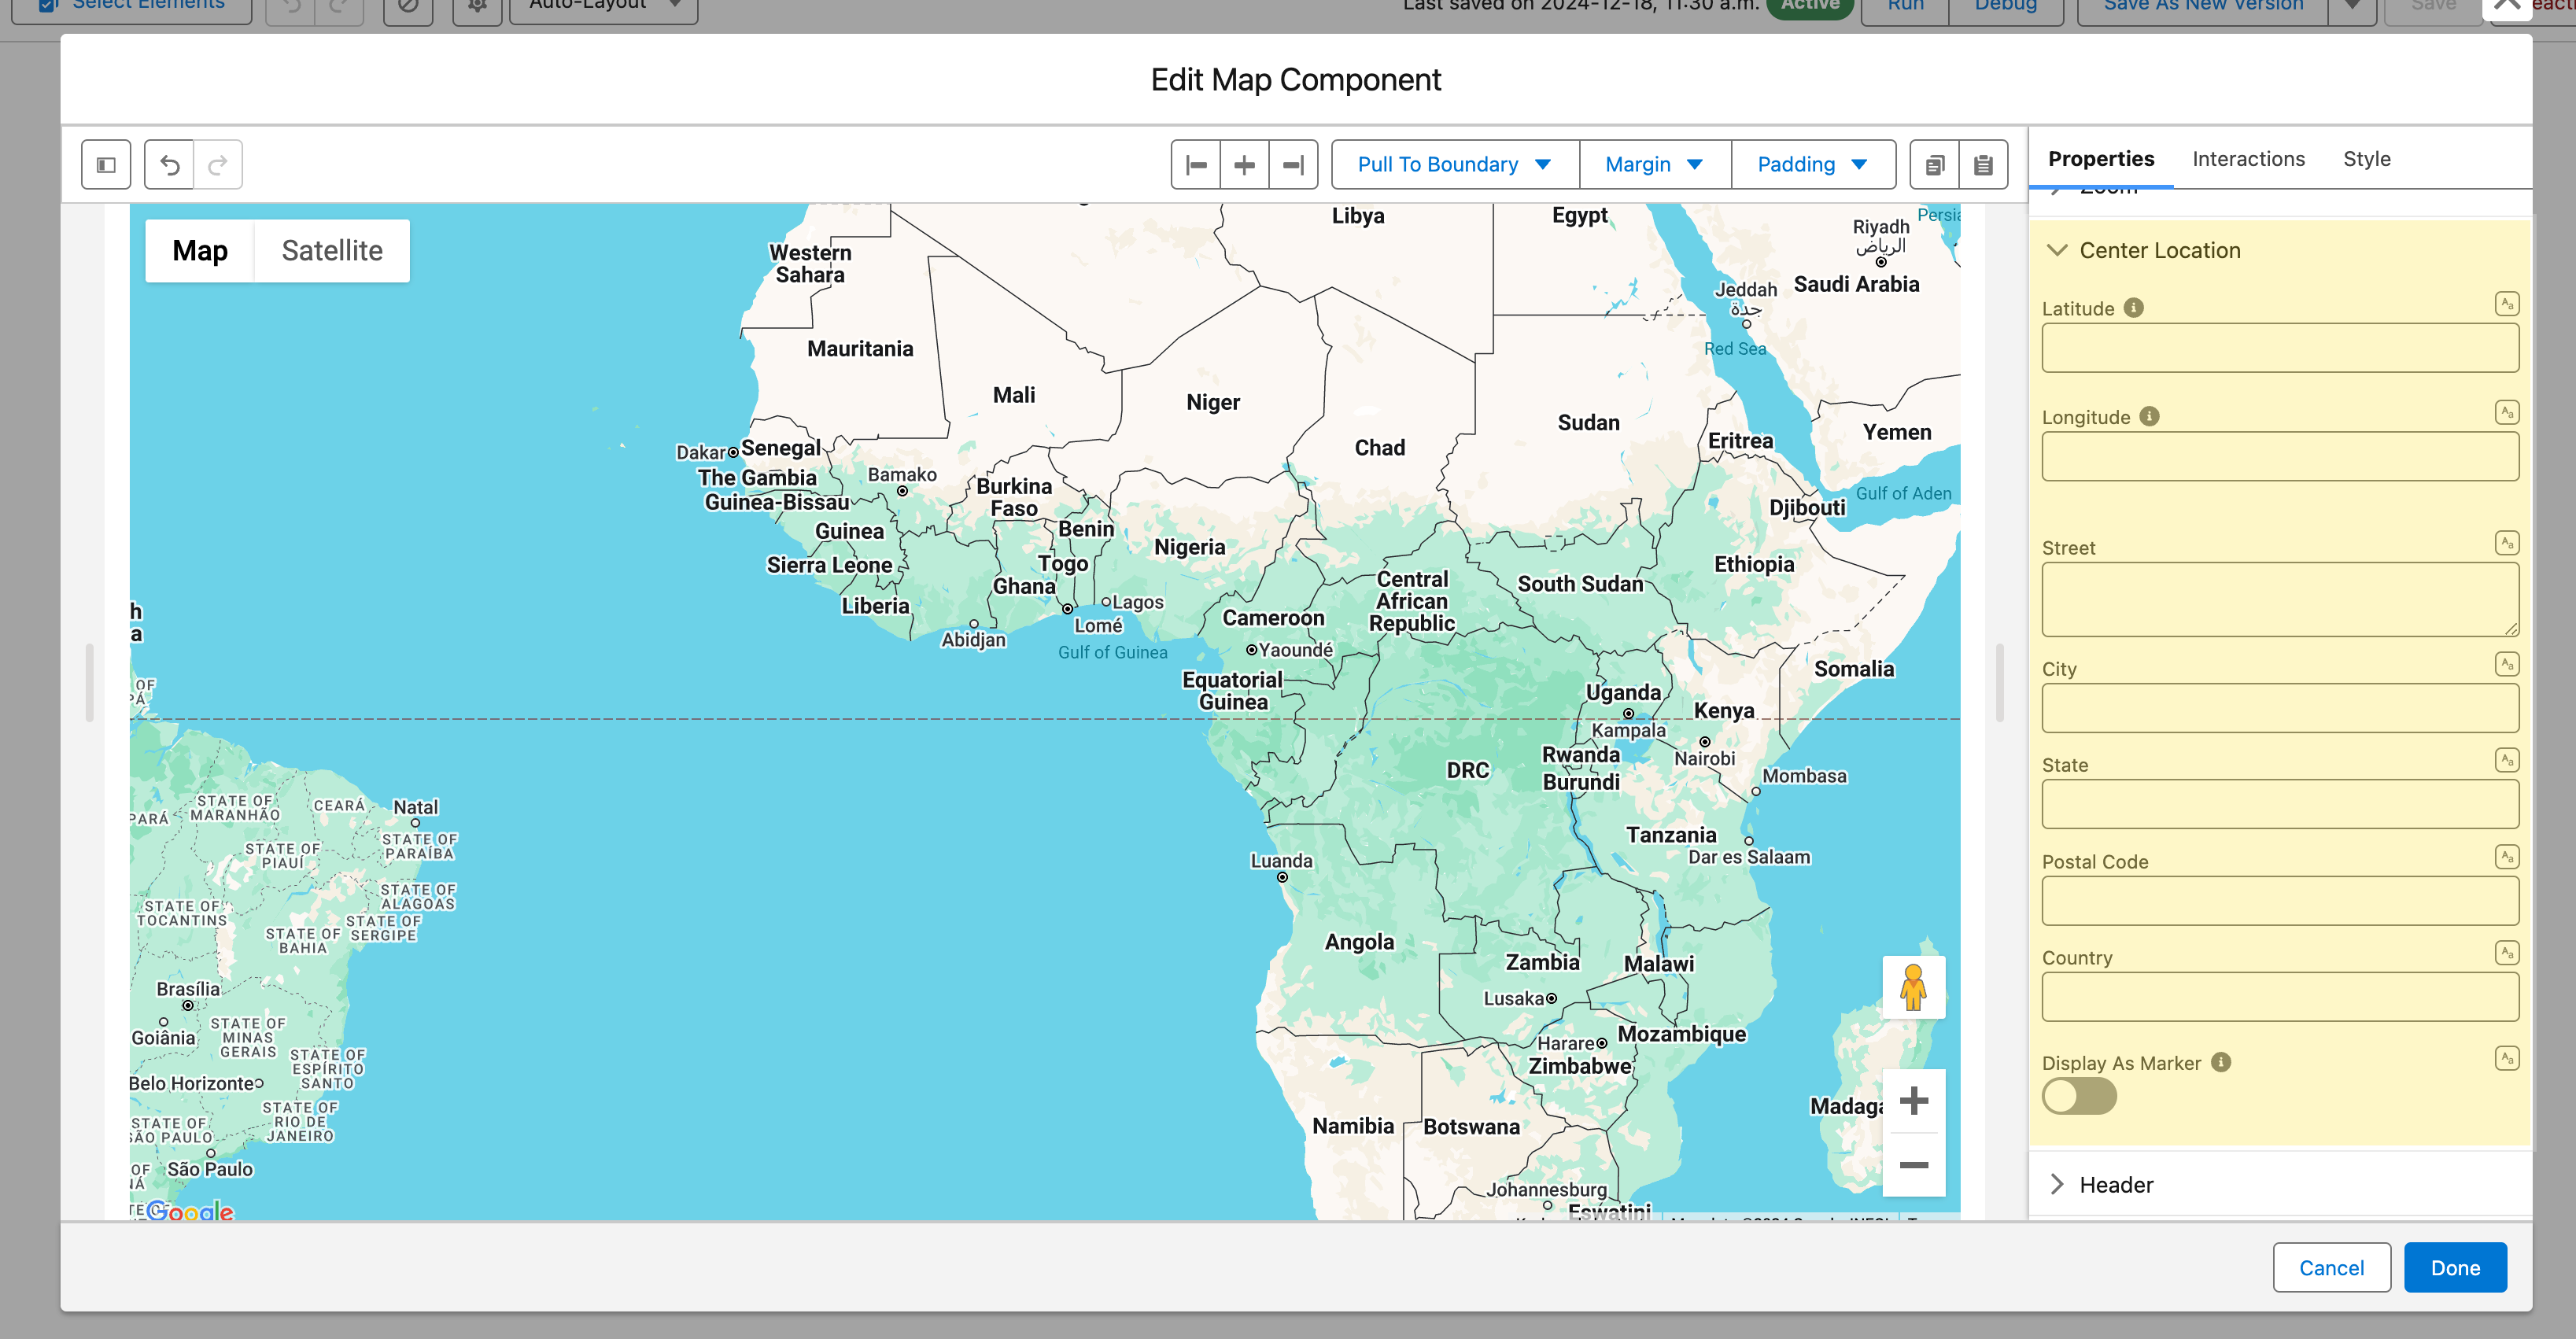
### Center Location

The map centers itself on all its markers unless you set a center here.

<figure><img src="https://27923732-files.gitbook.io/~/files/v0/b/gitbook-x-prod.appspot.com/o/spaces%2F1FUd4apB9YHgCEMUFbVb%2Fuploads%2Fgit-blob-215704fa098a457d8092398846aa4c9b9bd64c1f%2F2024-12-18_13-34-13.png?alt=media" alt=""><figcaption></figcaption></figure>

| Setting                     | What it does                                                                                     | Shown when  |
| --------------------------- | ------------------------------------------------------------------------------------------------ | ----------- |
| **Latitude**, **Longitude** | A fixed center point                                                                             | Always      |
| Address fields              | **Country** and **City** (required), optional **Street** and **Postal Code**                     | Google Maps |
| **Display As Marker**       | A pin at the center, for "find locations near this address" flows. Adds a **Type** for its shape | Always      |

Map the center fields to flow variables, such as `{!Account.BillingCity}`, to center on record data.

### Header

Title, caption, avatar and action buttons above the map.

<figure><img src="https://27923732-files.gitbook.io/~/files/v0/b/gitbook-x-prod.appspot.com/o/spaces%2F1FUd4apB9YHgCEMUFbVb%2Fuploads%2F4ESnp38L0cM6FiN0vqhD%2Fmap-header.png?alt=media" alt="The header of a Leaflet map: a green location icon as the avatar, the caption Plan the day&#x27;s route from the map above the title Customer visits, and on the right two action buttons, Log Visit and Share, followed by an open menu that holds a third action, Refresh. The top of the map, with two red markers, shows below."><figcaption><p>The header shows an avatar, a caption, a title and the header actions. The number of visible action buttons is set to 2, so the third action, Refresh, moves into the menu at the end of the button group.</p></figcaption></figure>

| Setting                     | What it does                                                                                                              |
| --------------------------- | ------------------------------------------------------------------------------------------------------------------------- |
| **Title**                   | Shown at the top of the map                                                                                               |
| **Caption**                 | Short text over the title                                                                                                 |
| **Avatar**                  | Image, initials or fallback icon, with a **Size** and a **Variant** (**Circle** or **Square**)                            |
| **Is Joined**               | Square, shadowless bottom border, so the map sits flush on an adjacent component                                          |
| **Actions**                 | Header buttons (**Label**, **Name**, **Icon Name**, **Disabled**, **Hidden**), wired to the **Header Action** interaction |
| **Visible Actions Buttons** | How many actions show as buttons; the rest go in a menu                                                                   |
| **Hide Actions**            | Hides the actions menu                                                                                                    |
| **Disable Actions**         | Disables the actions menu                                                                                                 |

### Filter

Filters narrow the markers shown. Pick the fields in **Data Mappings** > **Filters** (one menu each), then set the menus in the **Filter** group.

<figure><img src="https://27923732-files.gitbook.io/~/files/v0/b/gitbook-x-prod.appspot.com/o/spaces%2F1FUd4apB9YHgCEMUFbVb%2Fuploads%2FxrjrXLqpZT51BBShDcJs%2Fmap-builder-filters-search.png?alt=media" alt="The last two Data Mappings settings of the Map: Filters lists Industry and Account Type, and Search Fields lists Account Name and Billing City, each with a search box to add more." width="320"><figcaption><p>Filters and Search Fields are picked at the end of Data Mappings.</p></figcaption></figure>

| Setting                         | What it does                                                                                                        |
| ------------------------------- | ------------------------------------------------------------------------------------------------------------------- |
| **Type**                        | **Horizontal** (default, inline above the map), **Popover** (a filter button), **Panel** (a collapsible side panel) |
| **Display Overlaid on the Map** | Filters over the map instead of in the header. **Horizontal** and **Popover** only; for **Panel**, see Side Panel   |
| **Picklist Filter Sort Order**  | **Ascending** (default), **Descending**, **Default Order of Field**                                                 |
| **Use Record Picklist Values**  | Options from the values in the records, not the field's full value set                                              |

<figure><img src="https://27923732-files.gitbook.io/~/files/v0/b/gitbook-x-prod.appspot.com/o/spaces%2F1FUd4apB9YHgCEMUFbVb%2Fuploads%2FjioynqpPAXOOXQnaWSoq%2Fmap-filters-overlay.png?alt=media" alt="A Leaflet map titled Customer sites with five customer sites in Chicago. A Search sites box sits at the top left of the map and two filter buttons, Industry and Account Type, at the top right. The Industry filter is open and its filter mode menu lists Equals, selected, then Not Equals, Empty and Not Empty, over the list of industries. A Clear link and 5 of 5 sit at the bottom of the filter."><figcaption><p>Search and filters overlaid on the map. Each filter has a filter mode button: Equals, Not Equals, Empty or Not Empty.</p></figcaption></figure>

Each menu's **Filter mode** follows the field type, and end users pick it as they filter: nothing to configure.

<details>

<summary>Filter modes by field type</summary>

| Field type                  | Modes                                                                                                                                                                  |
| --------------------------- | ---------------------------------------------------------------------------------------------------------------------------------------------------------------------- |
| List, text and picklist     | **Equals** (default), **Not Equals**, **Empty**, **Not Empty**                                                                                                         |
| Number, date and time range | **Between** (default), **Not Between**, **Equals**, **Not Equals**, **Less Than**, **Less or Equal**, **Greater Than**, **Greater or Equal**, **Empty**, **Not Empty** |
| Checkbox                    | No mode button: always **Equals**                                                                                                                                      |

**Empty** and **Not Empty** test the field itself, so the menu hides its value inputs when either is selected.

</details>

### Search

**Show Search** adds a search bar over the fields picked in **Data Mappings** > **Search Fields**. Its settings appear once it is on.

| Setting         | What it does                                                                                                                                                   |
| --------------- | -------------------------------------------------------------------------------------------------------------------------------------------------------------- |
| **Placeholder** | Text in the empty bar. Default "Search"                                                                                                                        |
| **Position**    | **Left** (default), **Right**, **Center** or **Fill** in the header; **Panel** in the side panel; **Overlaid on the Map** (back in the header on a narrow map) |

### Side Panel

Appears when the filters or the search are set to **Panel**. On a narrow map, such as a phone, the filters become a popover and the search moves to the header.

<figure><img src="https://27923732-files.gitbook.io/~/files/v0/b/gitbook-x-prod.appspot.com/o/spaces%2F1FUd4apB9YHgCEMUFbVb%2Fuploads%2F95b9eu7H5nPAGxWzB2rj%2Fmap-side-panel.png?alt=media" alt="A Leaflet map titled Customer sites with a side panel on its left. The panel holds a Search sites box, an Industry filter listing Healthcare, Manufacturing, Retail, Technology and Transportation, an Account Type filter with Customer - Direct checked and Prospect unchecked, and a Clear all selections button. Both filters show an Equals filter mode button. The header reads 3 items found, Filtered by Account Type, and carries two actions, Log Visit and Share, and the button that shows or hides the panel. Three markers remain on the map."><figcaption><p>Filters and search in the side panel beside the map. Checking Customer - Direct leaves three sites on the map, and Clear all selections resets every filter.</p></figcaption></figure>

| Setting                         | What it does                                            | Shown when   |
| ------------------------------- | ------------------------------------------------------- | ------------ |
| **Position**                    | **Left** (default) or **Right**                         | Always       |
| **Display Overlaid on the Map** | Panel over the map, opened from a button on it          | Always       |
| **Closed by Default**           | Starts closed                                           | Not overlaid |
| **Opened by Default**           | Open when the map loads                                 | Overlaid     |
| **Hide Toggle Button**          | Hides the header button that opens and closes the panel | Not overlaid |
| **Reset Button Label**          | Default "Clear all selections"                          | Always       |

With both the side panel and the Route panel overlaid, only one is open at a time.

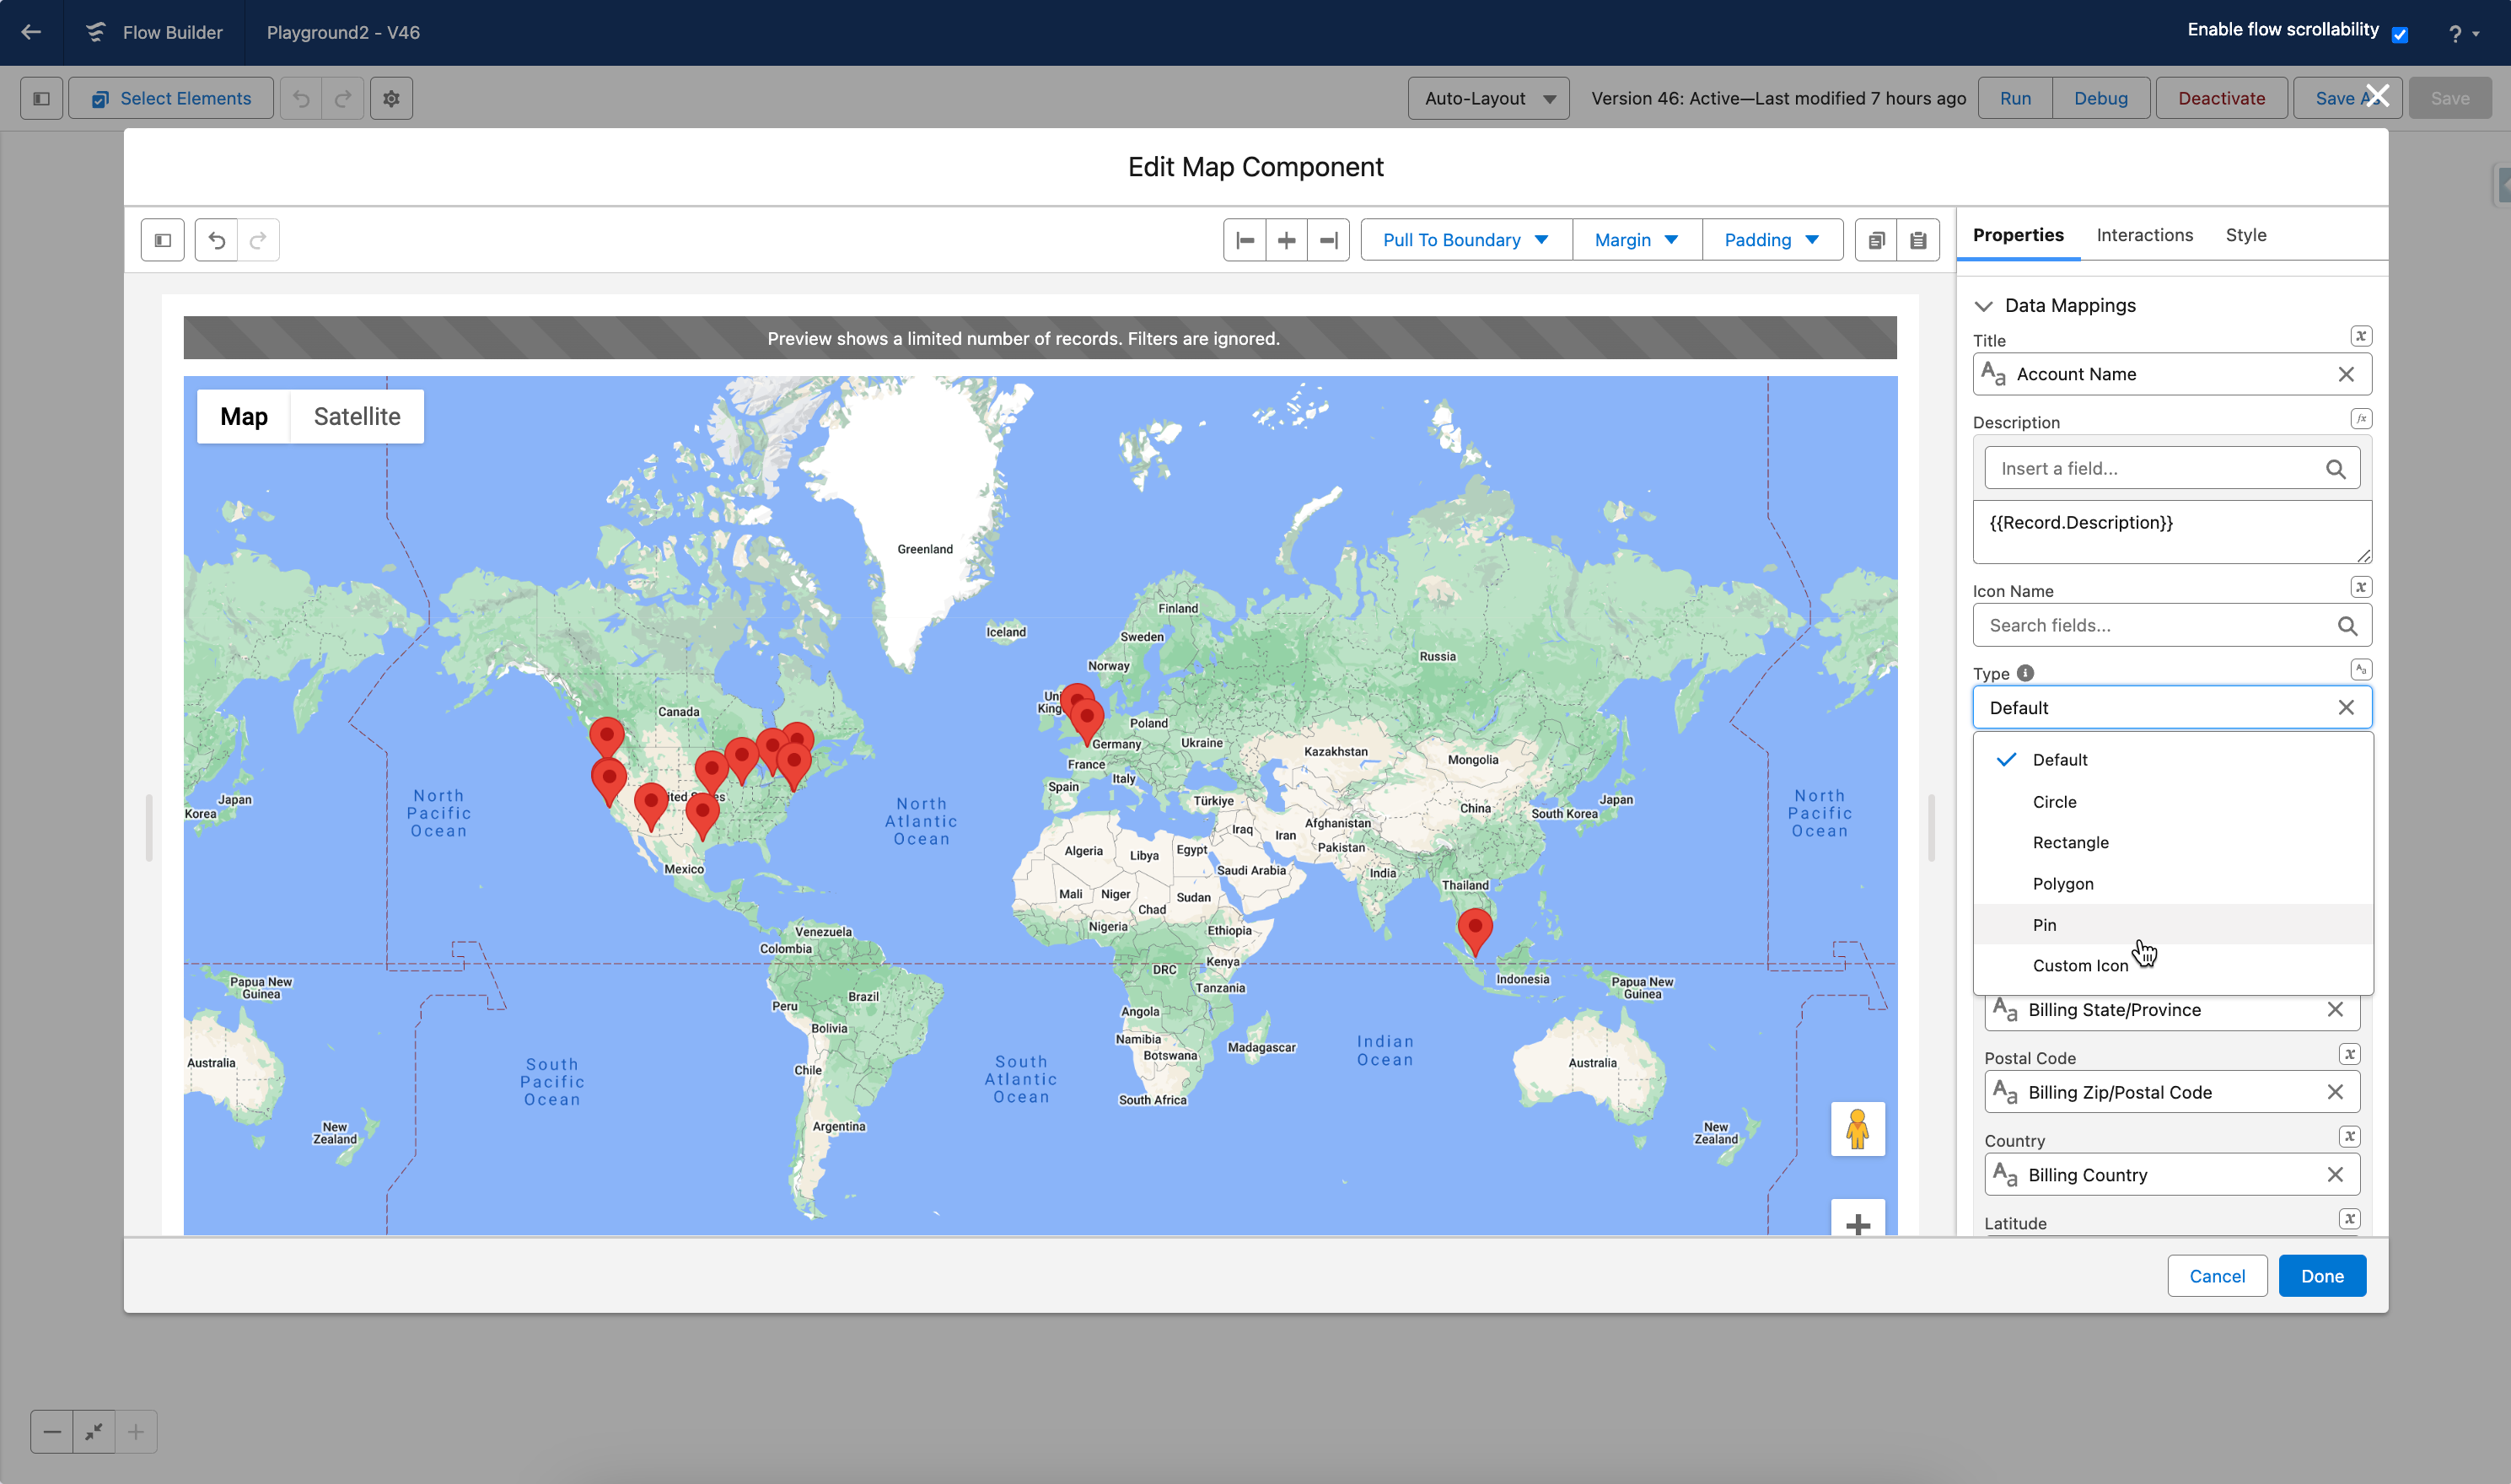
### Marker Customization

**Type** sets each marker's shape: in **Data Mappings**, or in the first group for a single marker.

<figure><img src="https://27923732-files.gitbook.io/~/files/v0/b/gitbook-x-prod.appspot.com/o/spaces%2F1FUd4apB9YHgCEMUFbVb%2Fuploads%2FbsZ0gGRwPyI4bjgJM7Xf%2Fmap-marker-types.png?alt=media" alt="A Leaflet map of the west side of Chicago with six markers in two rows. Top row, left to right: a red pin, a blue pin and a blue circle. Bottom row: a blue rectangle, a blue pentagon and an orange star."><figcaption><p>The six marker types on one map. Top row: Default, Pin and Circle. Bottom row: Rectangle, Polygon and Custom Icon, here a star drawn from an SVG path.</p></figcaption></figure>

| Type            | Settings                                                                     |
| --------------- | ---------------------------------------------------------------------------- |
| **Default**     | Standard map pin                                                             |
| **Circle**      | **Radius** (meters, default 25), fill, stroke                                |
| **Rectangle**   | **Bounds** (north and south latitude, east and west longitude), fill, stroke |
| **Polygon**     | **Paths** (latitude and longitude points), fill, stroke                      |
| **Pin**         | Classic teardrop pin: fill, stroke, **Scale**                                |
| **Custom Icon** | Your own icon from an **SVG Path**: fill, stroke, **Scale**                  |

Fill is **Fill Color** and **Fill Opacity**; stroke is **Stroke Color**, **Stroke Opacity** and **Stroke Weight**; **Scale** enlarges or shrinks the icon.

<figure><img src="https://27923732-files.gitbook.io/~/files/v0/b/gitbook-x-prod.appspot.com/o/spaces%2F1FUd4apB9YHgCEMUFbVb%2Fuploads%2Fgit-blob-2be4af5f34f3f8f604f5185613bc9794ed14b162%2F2024-05-23_21-44-44.png?alt=media" alt=""><figcaption></figcaption></figure>

> **What's an SVG Path?** Drawing instructions for an icon shape. Any vector design tool (Figma, Illustrator, online SVG editors) can produce one.
>
> <mark style="color:green;">**→ Tutorial:**</mark> [<mark style="color:green;">**Customize the Map Marker**</mark>](/flow/tutorials/components/map/customize-the-map-marker.md)

## Interactions

Interactions define what happens when end users interact with the Map. Configure them from the **Interactions** tab of the Edit Map Component dialog.

<figure><img src="https://27923732-files.gitbook.io/~/files/v0/b/gitbook-x-prod.appspot.com/o/spaces%2F1FUd4apB9YHgCEMUFbVb%2Fuploads%2FxqfvE9Gf0maZSy328tmN%2Fmap-builder-interactions.png?alt=media" alt="The Interactions tab of the Map with five events, each with its own Add button: Marker Created, Marker Select, Marker Drag, Header Action and Save As Button Click." width="320"><figcaption><p>The five events a Map can react to.</p></figcaption></figure>

| Interaction              | Fires when                                                                                                                   | Outputs set                                                                                |
| ------------------------ | ---------------------------------------------------------------------------------------------------------------------------- | ------------------------------------------------------------------------------------------ |
| **Marker Created**       | A marker is placed with the drawing tools                                                                                    | **Created Marker Latitude**, **Created Marker Longitude**                                  |
| **Marker Select**        | A marker is clicked. Use it to open a record, show details on the next screen, or branch the flow                            | **Selected Marker Value**, **Selected Marker SObject Value**, **Selected Markers SObject** |
| **Marker Drag**          | A marker is dragged. Requires **Draggable Markers**                                                                          | The seven **Dragged** outputs                                                              |
| **Header Action**        | A header action is clicked; **Target Name** picks which one                                                                  | **Clicked Header Action Name**, to branch on the action                                    |
| **Save As Button Click** | The drawing's save button is clicked. Requires **Save as Content Document**. Use it for a custom save flow or a confirmation | None of its own; **Content Document Id** holds the file                                    |

With several records at one address, the selection outputs describe the record shown in the popup. Paging does not fire **Marker Select** again; the next click on the marker does.

## Output Variables

Reference them after the screen: select the screen element in Flow Builder, then the Map, then the output variable.

| Output variable                                           | Type              | What it returns                                                                                                                                                                                   |
| --------------------------------------------------------- | ----------------- | ------------------------------------------------------------------------------------------------------------------------------------------------------------------------------------------------- |
| **Selected Marker Value**                                 | Text              | Value of the clicked marker, usually the record ID or name                                                                                                                                        |
| **Selected Marker SObject Value**                         | Record            | The clicked marker's record                                                                                                                                                                       |
| **Selected Markers SObject**                              | Record Collection | Every selected marker's record, with **Enable Multi-Select Markers**                                                                                                                              |
| **Dragged Marker Value**                                  | Text              | Value of the dragged marker                                                                                                                                                                       |
| **Dragged Marker SObject Value**                          | Record            | The dragged marker's record                                                                                                                                                                       |
| **Dragged Marker Latitude**, **Dragged Marker Longitude** | Text              | Its new position                                                                                                                                                                                  |
| **Dragged Map Markers**                                   | Collection        | All markers with their updated positions                                                                                                                                                          |
| **Dragged Map Markers Serialized**                        | Text              | The same, as a JSON string                                                                                                                                                                        |
| **Dragged Map Markers SObject**                           | Record Collection | The same, as Salesforce records                                                                                                                                                                   |
| **Created Marker Latitude**, **Created Marker Longitude** | Text              | Position of a marker placed with the drawing tools                                                                                                                                                |
| **Draw GeoJSON Value**                                    | Text              | Every drawn shape as GeoJSON: save it to a record or pass it to an Apex action for spatial queries                                                                                                |
| **Content Document Id**                                   | Text              | The saved drawing file, with **Save as Content Document** on                                                                                                                                      |
| **Clicked Header Action Name**                            | Text              | Name of the clicked header action                                                                                                                                                                 |
| **Number of Items**                                       | Integer           | Markers loaded on the map                                                                                                                                                                         |
| **Visible Width (km)**                                    | Integer           | Width of the visible area at the current zoom, to adjust queries or filters to it. On Leaflet, follows the end user's panning and zooming                                                         |
| **Center**                                                | Collection        | Current center: location (Latitude, Longitude, address fields such as City, State and Country) and display settings. Updates when changed programmatically, and on Leaflet when the end user pans |

> **Example:** On an Account map, use **Selected Marker SObject Value** to show the clicked Account on the next screen or pre-fill a follow-up Task.

## Styling

Style the Map from the **Style** tab. Side panel groups appear when the filters or the search are set to **Panel**; the Flow Dialog and Flow Panel groups appear with an **Open Flow Dialog** or **Open Flow Panel** interaction and style the flow it opens.

<figure><img src="https://27923732-files.gitbook.io/~/files/v0/b/gitbook-x-prod.appspot.com/o/spaces%2F1FUd4apB9YHgCEMUFbVb%2Fuploads%2Fl7HEewtZncEwFGnR8FGg%2Fmap-builder-style.png?alt=media" alt="The Style tab of a Leaflet map, every group collapsed: Margin, Padding, Size, Border, Header, Header Border, Header Title, Header Caption, Header Actions, Header Avatar, Map Markers Background, Map Markers Title, Map Markers Description, Map Markers Info, Map Markers Fields, Map Markers Fields Label, Map Markers Fields Value, Route Panel, Route Panel Header, Zoom Controls, Draw Controls and Selected Marker." width="320"><figcaption><p>The Style tab of a Leaflet map with no side panel and no Open Flow Dialog or Open Flow Panel interaction.</p></figcaption></figure>

| Group                                                      | Styles                                                                                                    | Shown when       |
| ---------------------------------------------------------- | --------------------------------------------------------------------------------------------------------- | ---------------- |
| **Margin**, **Padding**                                    | Top, Right, Bottom, Left                                                                                  | Always           |
| **Size**                                                   | Width, Height, Min Width, Max Width, Min Height, Max Height                                               | Always           |
| **Border**                                                 | Color, Size, Style, Radius                                                                                | Always           |
| **Header**                                                 | Background Color; Padding Top, Right, Bottom, Left; Margin Bottom                                         | Always           |
| **Header Border**                                          | Color, Size, Style, Radius; Bottom Border Color, Size and Style for **Is Joined**                         | Always           |
| **Header Title**, **Header Caption**                       | Color, Font Size, Font Style, Font Weight                                                                 | Always           |
| **Header Actions**                                         | Text Color, Background Color, Border Color, each also Active and Hover                                    | Always           |
| **Header Avatar**                                          | Background Color, Foreground Color, Border Radius                                                         | Always           |
| **Map Markers Background**                                 | Color of the markers                                                                                      | Leaflet          |
| **Map Markers Title**                                      | Text Color, Font Size, Font Style, Font Weight of the popup title                                         | Leaflet          |
| **Map Markers Description**                                | Color, Font Size, Font Style, Font Weight, Line Clamp (lines shown before truncation)                     | Leaflet          |
| **Map Markers Info**                                       | Text Color, Link Color, Link Color Hover, Font Size, Font Style, Font Weight                              | Leaflet          |
| **Map Markers Fields**                                     | Background Color; Border Color, Size, Style, Radius; Spacing Inline, Spacing Block                        | Leaflet          |
| **Map Markers Fields Label**, **Map Markers Fields Value** | Color, Font Size, Font Style, Font Weight                                                                 | Leaflet          |
| **Route Panel**                                            | Background Color; Border Color, Size, Style, Radius                                                       | Leaflet          |
| **Route Panel Header**                                     | Background Color, Color (title), Font Size, Font Weight                                                   | Leaflet          |
| **Zoom Controls**                                          | Text Color, Background Color, Shadow Color; Border Color, Size, Style, Radius                             | Leaflet          |
| **Draw Controls**                                          | Background Color, Shadow Color; Border Color, Size, Style, Radius                                         | Leaflet          |
| **Selected Marker**                                        | Scale of the selected marker                                                                              | Leaflet          |
| **Filters Panel**                                          | Background Color; Border Color, Size, Style, Radius                                                       | Side panel       |
| **Filters Panel Labels**                                   | Background and Color, each also Active and Hover; Collapse Icon Color; Font Size, Font Weight             | Side panel       |
| **Filters Panel Options**                                  | Color; Checkbox Border Color; Load More Button Text Color, also Active and Hover                          | Side panel       |
| **Filters Panel Reset Button**                             | Background Color, Text Color; Border Color, Size, Radius; Background and Border Color, Hover and Active   | Side panel       |
| **Flow Dialog Header**                                     | Background; Bottom Border Color, Size; Label Color, Font Size, Font Weight                                | Open Flow Dialog |
| **Flow Dialog Footer**                                     | Background; Top Border Color, Size                                                                        | Open Flow Dialog |
| **Flow Panel**                                             | Background Color; Border Color, Size, Style, Radius                                                       | Open Flow Panel  |
| **Flow Panel Header**                                      | Background; Bottom Border Color, Size; Label Color, Font Size, Font Weight; Close Icon Color, also Active | Open Flow Panel  |

***

## Troubleshooting Common Issues

The most common Map issues, grouped by how they show up. If the map worked before and broke after you changed a setting, start with the first table.

### After Editing the Component

| Problem                                                                        | Cause                                                                                                                                                                                                                                                   | Fix                                                                                                                         |
| ------------------------------------------------------------------------------ | ------------------------------------------------------------------------------------------------------------------------------------------------------------------------------------------------------------------------------------------------------- | --------------------------------------------------------------------------------------------------------------------------- |
| Markers disappeared after changing the **Data Source** or the source object    | The field mappings from the previous setup no longer apply, so the component finds no location fields to read                                                                                                                                           | Reopen **Data Mappings** in the **Properties** tab and re-map at least the **Location** section for the new source          |
| Markers disappeared after switching from **Google Maps** to **Leaflet**        | Leaflet places markers only by Latitude + Longitude. Address fields are ignored because Leaflet cannot geocode                                                                                                                                          | Map Latitude and Longitude in **Data Mappings**, or switch back to Google Maps for address-based records                    |
| The map no longer recenters when the mapped **Center Location** changes        | **Display As Marker** is on. At runtime, the component stops applying center updates coming from variables because it cannot tell a user pan apart from a variable change. The Component Builder preview still recenters, which makes this easy to miss | Turn off **Display As Marker** when the center must follow a flow variable                                                  |
| The map is configured correctly but shows nothing at runtime (preview is fine) | With **Data Source** set to **Variable**, the collection is empty when the screen loads: the Get Records or Assignment element feeding it has not run yet                                                                                               | Place the Get Records element before the screen and confirm the variable is populated on every path that reaches the screen |

### Error Messages and Blank Maps

| Problem                                                            | Cause                                                                                                                                                                                              | Fix                                                                                                                                                                                       |
| ------------------------------------------------------------------ | -------------------------------------------------------------------------------------------------------------------------------------------------------------------------------------------------- | ----------------------------------------------------------------------------------------------------------------------------------------------------------------------------------------- |
| Toast: "Error creating your content document" when saving drawings | **Content Document Linked Entity Id** does not resolve to a valid record ID at runtime, or the running user cannot create Files                                                                    | Set **Content Document Linked Entity Id** to a real record ID (typically `{!recordId}`) and confirm the running user can create Files on that record                                      |
| Toast: "Error updating your content document"                      | The file referenced by **Content Document Id** was deleted, or the running user has no edit access to it                                                                                           | Clear **Content Document Id** so the component creates a new file, or restore access to the existing one                                                                                  |
| Toast: "The file you are trying to upload is too large"            | The GeoJSON or drawing file exceeds the 12MB Apex heap size limit that Salesforce enforces when the component reads the file                                                                       | Simplify the geometry or split the data into files under 12MB                                                                                                                             |
| The map shows a gray empty area instead of tiles                   | Google Maps: map settings are disabled in Setup. Leaflet: the tile server is blocked or the custom **Tile Layer** URL is invalid. The default OpenStreetMap server needs to be trusted by your org | Google: check **Setup > Maps and Location Settings**. Leaflet: add `https://tile.openstreetmap.org` to **Setup > Trusted URLs**, and clear **Tile Layer** to return to the default server |

### Markers, Outputs, and Browsers

| Problem                                                                           | Cause                                                                                                                                      | Fix                                                                                                                                                                         |
| --------------------------------------------------------------------------------- | ------------------------------------------------------------------------------------------------------------------------------------------ | --------------------------------------------------------------------------------------------------------------------------------------------------------------------------- |
| No markers appear at all                                                          | The records have no usable location data. A marker needs Latitude + Longitude, or at least one of City, State, Postal Code, or Country     | In **Data Mappings**, map at least one location field to a populated field and confirm the records contain values                                                           |
| Single marker mode shows no marker                                                | Every location field is empty at runtime, so the component hides the marker without an error                                               | Make sure at least one location value (Latitude + Longitude, City, State, Postal Code, or Country) is set when the screen loads                                             |
| Marker clustering has no effect                                                   | Clustering is a Leaflet-only feature, or **Enable Marker Clustering** is off                                                               | Switch **Type** to **Leaflet** and turn on **Enable Marker Clustering**                                                                                                     |
| The map ignores a `{!recordId}` filter                                            | The **Data Source** is **Variable**, so no server-side filtering applies                                                                   | Use the **Query** data source and add a query filter that references `{!recordId}`                                                                                          |
| Output variables stay empty after the screen                                      | Output variables only populate after the user interacts with the map. Dragged outputs also require **Draggable Markers** to be on          | Enable the matching feature, and add a Decision element after the screen to handle the empty case                                                                           |
| A dragged marker's new position is not saved to the record                        | Dragging only updates the **Dragged Marker** output variables. The component writes nothing to Salesforce on its own                       | After the screen, add an Update Records element that saves **Dragged Marker Latitude** and **Dragged Marker Longitude** to the record                                       |
| Marker clicks do nothing in Firefox (Chrome works)                                | A Firefox-specific conflict between Salesforce Lightning Web Security and the map library blocked click handling in older package versions | Update Avonni Flow Screen Components to 6.30.0 or later (and Experience Components to 1.25.0 or later when the flow runs on an Experience site)                             |
| On an Experience Cloud site, the header menu dropdowns are cut off behind the map | The map draws above the standard theme header                                                                                              | In the site's CSS editor, add `.forceCommunityThemeHeaderBase { z-index: 91; }` to raise the header and its menus above the map                                             |
| No **Route** button on the map                                                    | Routing is a Leaflet-only feature, or **Show Route Panel** is off                                                                          | Switch **Type** to **Leaflet** and turn on **Show Route Panel**                                                                                                             |
| The **Route** group shows a notice instead of **Show Route Panel**                | Routing is not enabled for this package yet                                                                                                | An administrator enables routing from the **Settings** tab of the **Avonni Flow Components** app: see [Enable Map Routing](/flow/flow-components/map/enable-map-routing.md) |
| No **Timing** setting, and no arrival times in the panel or the CSV               | OpenRouteService is the active provider. It has no traffic model, so a departure time would not change the route                           | Switch the active provider to Mapbox in the **Settings** tab if departure and arrival times are needed                                                                      |

***


---

# Agent Instructions
This documentation is published with GitBook. GitBook is the documentation platform designed so that both humans and AI agents can read, navigate, and reason over technical content effectively. Learn more at gitbook.com.

## Querying This Documentation
If you need additional information that is not directly available in this page, you can query the documentation by asking a question.

Perform an HTTP GET request on the following URL with the `ask` and `goal` query parameters:

```
GET https://docs.avonnicomponents.com/flow/flow-components/map.md?ask=<question>&goal=<user_goal>
```

`ask` is the immediate question: it should be specific, self-contained, and written in natural language.
`goal` is what the user is ultimately trying to achieve, the reason they need the answer. Sharing it helps GitBook give you a better, more relevant answer. A goal is most helpful when it describes the outcome the user wants rather than restating the question. For example, with `ask=how do I create an API token`, a goal like `automate deployments from our CI pipeline` lets GitBook tailor the answer to that use case.

The response will contain a direct answer to the question and relevant excerpts and sources from the documentation.

Use this mechanism when the answer is not explicitly present in the current page, you need clarification or additional context, or you want to retrieve related documentation sections.