> For the complete documentation index, see [llms.txt](https://docs.avonnicomponents.com/llms.txt). Markdown versions of documentation pages are available by appending `.md` to page URLs; this page is available as [Markdown](https://docs.avonnicomponents.com/dynamic-components/components/chart.md).

# Chart

## Overview

Use Chart to turn Salesforce records into totals, trends and comparisons on a Lightning Page. Choose a chart type, connect records, then map the fields that define its categories and values.

## Tutorials

Follow the [Chart tutorials](https://docs.avonnicomponents.com/dynamic-components/tutorials/components/chart.md) to build and verify a complete view from your Salesforce records.

<table data-view="cards"><thead><tr><th></th><th></th><th data-hidden data-card-cover data-type="files"></th><th data-hidden data-card-target data-type="content-ref"></th></tr></thead><tbody><tr><td><strong>Compare Total and Average Deal Size</strong></td><td>Build a Combo chart that compares open pipeline totals with average deal size by stage, then verify its measures against the source records.</td><td><a href="https://2532358799-files.gitbook.io/~/files/v0/b/gitbook-x-prod.appspot.com/o/spaces%2FODPvvv7Cx9Z9RECLn3oV%2Fuploads%2FjMfQIwgcOtv0fRtOf022%2Fcover-compare-total-and-average-deal-size.png?alt=media">cover-compare-total-and-average-deal-size.png</a></td><td><a href="https://docs.avonnicomponents.com/dynamic-components/tutorials/components/chart/compare-total-and-average-deal-size.md">Compare Total and Average Deal Size</a></td></tr><tr><td><strong>Track Won Revenue by Month</strong></td><td>Build a Line chart of won Opportunity revenue by year and month, keeping January in different years separate and checking each monthly total.</td><td><a href="https://2532358799-files.gitbook.io/~/files/v0/b/gitbook-x-prod.appspot.com/o/spaces%2FODPvvv7Cx9Z9RECLn3oV%2Fuploads%2Fub23f7jV0DjUS4fulgSO%2Fcover-track-won-revenue-by-month.png?alt=media">cover-track-won-revenue-by-month.png</a></td><td><a href="https://docs.avonnicomponents.com/dynamic-components/tutorials/components/chart/track-won-revenue-by-month.md">Track Won Revenue by Month</a></td></tr><tr><td><strong>Map Account Coverage by Province</strong></td><td>Build a Canada map from Account records, count accounts by province, and check full province names so missing matches do not hide coverage.</td><td><a href="https://2532358799-files.gitbook.io/~/files/v0/b/gitbook-x-prod.appspot.com/o/spaces%2FODPvvv7Cx9Z9RECLn3oV%2Fuploads%2Fmr1XGCqewAsLkejM4XNc%2Fcover-map-account-coverage-by-province.png?alt=media">cover-map-account-coverage-by-province.png</a></td><td><a href="https://docs.avonnicomponents.com/dynamic-components/tutorials/components/chart/map-account-coverage-by-province.md">Map Account Coverage by Province</a></td></tr><tr><td><strong>Understand Account Industries</strong></td><td>Build a Word Cloud from Account industries, size each label by record count, and check missing labels before interpreting your customer mix.</td><td><a href="https://2532358799-files.gitbook.io/~/files/v0/b/gitbook-x-prod.appspot.com/o/spaces%2FODPvvv7Cx9Z9RECLn3oV%2Fuploads%2FZx3GI2ddjYHdvGTu4gem%2Fcover-understand-account-industries.png?alt=media">cover-understand-account-industries.png</a></td><td><a href="https://docs.avonnicomponents.com/dynamic-components/tutorials/components/chart/understand-account-industries.md">Understand Account Industries</a></td></tr><tr><td><strong>Compare Won Revenue by Lead Source</strong></td><td>Build a Donut chart of won revenue by lead source, then compare its revenue shares with deal counts to see which sources bring larger wins.</td><td><a href="https://2532358799-files.gitbook.io/~/files/v0/b/gitbook-x-prod.appspot.com/o/spaces%2FODPvvv7Cx9Z9RECLn3oV%2Fuploads%2FoJzpD5AUYIrSFHglEWDL%2Fcover-compare-won-revenue-by-lead-source.png?alt=media">cover-compare-won-revenue-by-lead-source.png</a></td><td><a href="https://docs.avonnicomponents.com/dynamic-components/tutorials/components/chart/compare-won-revenue-by-lead-source.md">Compare Won Revenue by Lead Source</a></td></tr><tr><td><strong>Measure Won Revenue Against a Target</strong></td><td>Build a Gauge chart that compares won Opportunity revenue with a fixed monetary target, then verify its value, range and progress percentage.</td><td><a href="https://2532358799-files.gitbook.io/~/files/v0/b/gitbook-x-prod.appspot.com/o/spaces%2FODPvvv7Cx9Z9RECLn3oV%2Fuploads%2FsBKGI91nI2lHaFF4YHU8%2Fcover-measure-won-revenue-against-a-target.png?alt=media">cover-measure-won-revenue-against-a-target.png</a></td><td><a href="https://docs.avonnicomponents.com/dynamic-components/tutorials/components/chart/measure-won-revenue-against-a-target.md">Measure Won Revenue Against a Target</a></td></tr><tr><td><strong>Compare Support Backlog by Status and Priority</strong></td><td>Build a Stacked Column chart of open Cases by status and priority, then normalize each stack to compare priority mix as well as backlog size.</td><td><a href="https://2532358799-files.gitbook.io/~/files/v0/b/gitbook-x-prod.appspot.com/o/spaces%2FODPvvv7Cx9Z9RECLn3oV%2Fuploads%2FroIPdOYYg8OrnStphsVR%2Fcover-compare-support-backlog-by-status-and-priority.png?alt=media">cover-compare-support-backlog-by-status-and-priority.png</a></td><td><a href="https://docs.avonnicomponents.com/dynamic-components/tutorials/components/chart/compare-support-backlog-by-status-and-priority.md">Compare Support Backlog by Status and Priority</a></td></tr><tr><td><strong>Select an Account to Filter Its Pipeline Chart</strong></td><td>Connect an Account Combobox to an open-pipeline Bar chart, then test automatic query updates, account totals and an account with no open deals.</td><td><a href="https://2532358799-files.gitbook.io/~/files/v0/b/gitbook-x-prod.appspot.com/o/spaces%2FODPvvv7Cx9Z9RECLn3oV%2Fuploads%2FaZQ1tEurIJkp2zDP06EX%2Fcover-select-an-account-to-filter-its-pipeline-chart.png?alt=media">cover-select-an-account-to-filter-its-pipeline-chart.png</a></td><td><a href="https://docs.avonnicomponents.com/dynamic-components/tutorials/components/chart/select-an-account-to-filter-its-pipeline-chart.md">Select an Account to Filter Its Pipeline Chart</a></td></tr><tr><td><a href="https://docs.avonnicomponents.com/projects/use-cases/reporting/bookings-stacked-by-region.md">Chart Salesforce Opportunity Bookings by Month and Region</a></td><td>Create an Avonni stacked column chart on a Salesforce Lightning page to sum Closed Won Opportunity bookings by month and region for the current fiscal year.</td><td><a href="https://2532358799-files.gitbook.io/~/files/v0/b/gitbook-x-prod.appspot.com/o/spaces%2FODPvvv7Cx9Z9RECLn3oV%2Fuploads%2FDwVu1ytzzfIJ5QzlCX12%2Ftutorial-bookings-stacked-by-region.png?alt=media">tutorial-bookings-stacked-by-region.png</a></td><td><a href="https://docs.avonnicomponents.com/projects/use-cases/reporting/bookings-stacked-by-region.md">Chart Salesforce Opportunity Bookings by Month and Region</a></td></tr></tbody></table>

### Choose a chart type

Start with the business question you want the chart to answer.

| Build this                              | Start with          |
| --------------------------------------- | ------------------- |
| Open pipeline by stage                  | Bar or Column       |
| Pipeline share by lead source           | Donut               |
| Progress against a target               | Gauge or Flat Gauge |
| Total and average deal amounts together | Combo               |
| Account coverage by province            | Choropleth Map      |
| Most common account industries          | Word Cloud          |

Start with the [configuration reference](#configuration), then adjust [colors](#colors) and [styling](#styling). To follow a complete setup, jump to the [pipeline quick start](#quick-start-opportunity-pipeline-chart) or [more chart examples](#more-chart-examples).

<details>

<summary>See more chart types</summary>

<figure><img src="https://2532358799-files.gitbook.io/~/files/v0/b/gitbook-x-prod.appspot.com/o/spaces%2FODPvvv7Cx9Z9RECLn3oV%2Fuploads%2FKD1aQtFlnuUOvzAIlFyT%2Fchart-types.png?alt=media" alt="Six of the chart types, all built from the same Opportunity query"><figcaption><p>Six of the chart types, all built from the same Opportunity query</p></figcaption></figure>

[View the chart gallery at full size](https://2532358799-files.gitbook.io/~/files/v0/b/gitbook-x-prod.appspot.com/o/spaces%2FODPvvv7Cx9Z9RECLn3oV%2Fuploads%2FKD1aQtFlnuUOvzAIlFyT%2Fchart-types.png?alt=media)

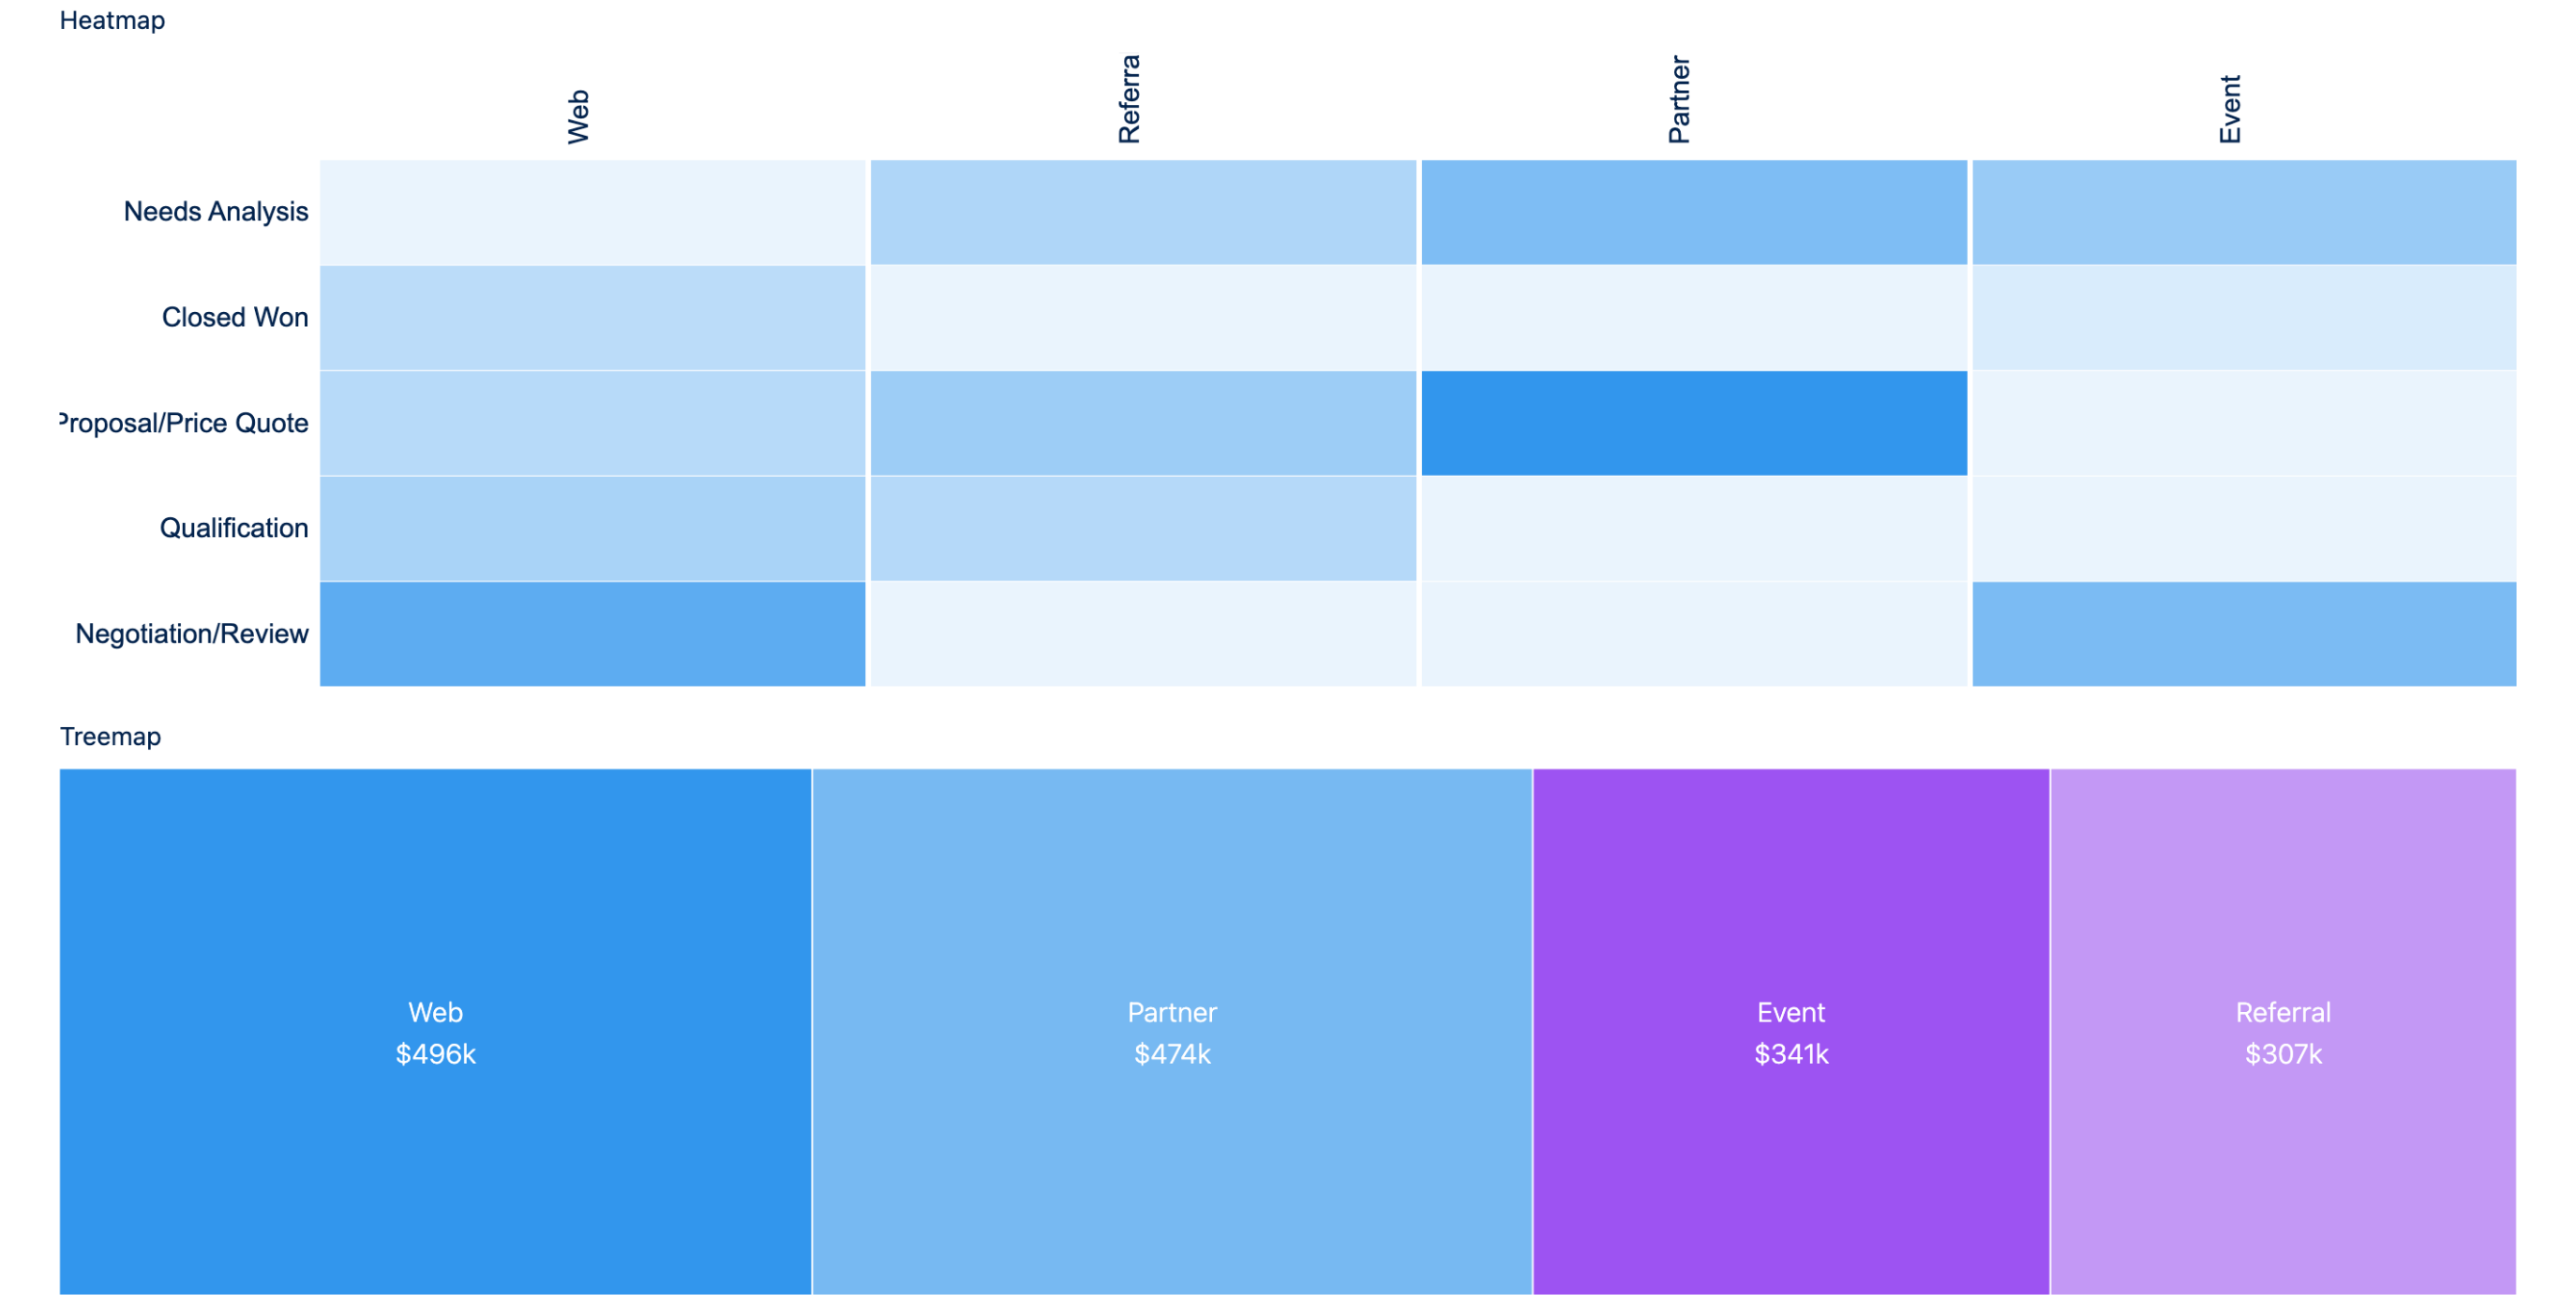
<figure><img src="https://2532358799-files.gitbook.io/~/files/v0/b/gitbook-x-prod.appspot.com/o/spaces%2FODPvvv7Cx9Z9RECLn3oV%2Fuploads%2FNazTw6994ymxcRmUpmG0%2Fchart-heatmap-treemap.png?alt=media" alt="A heatmap and a treemap over the same Opportunity query"><figcaption><p>Heatmap and Treemap, the two types added in the 1.54 release</p></figcaption></figure>

[View Heatmap and Treemap at full size](https://2532358799-files.gitbook.io/~/files/v0/b/gitbook-x-prod.appspot.com/o/spaces%2FODPvvv7Cx9Z9RECLn3oV%2Fuploads%2FNazTw6994ymxcRmUpmG0%2Fchart-heatmap-treemap.png?alt=media)

</details>

## Projects

See how Chart fits into a complete Salesforce workflow. Each project includes steps to build it with AI or manually.

<table data-view="cards"><thead><tr><th></th><th></th><th data-hidden data-card-cover data-type="image">Cover image</th></tr></thead><tbody><tr><td><h4><a href="https://docs.avonnicomponents.com/projects/use-cases/record-pages/account-highlight-panel">Account Highlight Panel</a></h4></td><td>Add on to the highlight panel using Dynamic components and charts.</td><td data-object-fit="fill"><a href="https://3857391697-files.gitbook.io/~/files/v0/b/gitbook-x-prod.appspot.com/o/spaces%2FdHOej9Pd5IxJNGEJMZKW%2Fuploads%2FVnk5SIapyqT0Rrh78QgN%2Faccount-highlight-panel-cover.png?alt=media">https://3857391697-files.gitbook.io/~/files/v0/b/gitbook-x-prod.appspot.com/o/spaces%2FdHOej9Pd5IxJNGEJMZKW%2Fuploads%2FVnk5SIapyqT0Rrh78QgN%2Faccount-highlight-panel-cover.png?alt=media</a></td></tr><tr><td><h4><a href="https://docs.avonnicomponents.com/projects/use-cases/record-pages/account-research-panel">Account Research Panel</a></h4></td><td>Compose an Agentforce agent with live account metrics that refresh as it answers.</td><td data-object-fit="fill"><a href="https://3857391697-files.gitbook.io/~/files/v0/b/gitbook-x-prod.appspot.com/o/spaces%2FdHOej9Pd5IxJNGEJMZKW%2Fuploads%2FHy2vpxtmiMOSgMgAKB0m%2Faccount-research-panel-cover.png?alt=media">https://3857391697-files.gitbook.io/~/files/v0/b/gitbook-x-prod.appspot.com/o/spaces%2FdHOej9Pd5IxJNGEJMZKW%2Fuploads%2FHy2vpxtmiMOSgMgAKB0m%2Faccount-research-panel-cover.png?alt=media</a></td></tr></tbody></table>

## Configuration

Select the Chart on the canvas to open **Edit Chart**. Use **Properties** for records, mappings and chart settings; use **Style** for layout, borders and type-specific styling.

### Data Source

| Source   | When to use it                                | Where to configure it                                                                        |
| -------- | --------------------------------------------- | -------------------------------------------------------------------------------------------- |
| Query    | Fetch records from a Salesforce object        | Select the query in Records. Use Edit the query to set its object, filters and sorting.      |
| Variable | Reuse records already held by a page variable | Select the variable holding the records. Check that it is populated when the chart is shown. |

### Data Mapping

Set **Content > Type** before mapping your data. The available mapping labels change with the chart type.

The category entry answers **"group by what?"**. The measure entry answers **"calculate what?"**. For example, the pipeline bar chart groups by Stage and calculates the Sum of Amount.

<details>

<summary>Mapping slots for every chart type</summary>

| Type                                     | Grouping slot             | Measured slot         | Also                           |
| ---------------------------------------- | ------------------------- | --------------------- | ------------------------------ |
| Area                                     | **X-Axis**                | **Y-Axis**            | **Lines**                      |
| Bar, Stacked Bar, Column, Stacked Column | **Bars**                  | **Bar Length**        | **Bar Segments**, stacked only |
| Pyramid, Stacked Pyramid                 | **Bars**                  | **Left & Right Axis** | **Bar Segments**, stacked only |
| Line                                     | **X-Axis**                | **Y-Axis**            | **Lines**                      |
| Combo                                    | **X-Axis**                | **Y-Axis**            |                                |
| Metrics Radar                            | **Polygons**              | **Axes**              |                                |
| Donut                                    | **Sliced By**             | **Value**             |                                |
| Gauge, Flat Gauge                        | none                      | **Value**             |                                |
| Heatmap                                  | **X-Axis** and **Y-Axis** | **Value**             |                                |
| Matrix                                   | **X-Axis** and **Y-Axis** | **Bubble Size**       | **Bubble Color**               |
| Treemap                                  | **Segments**              | **Segment Size**      |                                |
| Funnel                                   | **Segment**               | **Segment Size**      |                                |
| Calendar Heatmap                         | **Time Periods**          | **Color**             |                                |
| Choropleth Map                           | **Region**                | **Value**             |                                |
| Word Cloud                               | **Words**                 | **Word Size**         |                                |

**Bars** accepts multiple grouping fields on Bar and Column charts. **Segments** accepts two on a Treemap. **Words** accepts multiple entries. Combo uses multiple **Y-Axis** entries, one per measure. The [map example](#choropleth-map-count-accounts-by-province) and [word cloud example](#word-cloud-show-the-most-common-account-industries) explain their specific entries.

</details>

<details>

<summary>Grouping fields and date periods</summary>

| Setting                      | What it does                                                                                                                       |
| ---------------------------- | ---------------------------------------------------------------------------------------------------------------------------------- |
| **Field**                    | The Salesforce field whose values become the categories.                                                                           |
| **Group**                    | For a date field, the period to group by: Year, Quarter, Month, Week, Day, Year-Quarter, Year-Month, Year-Week, or Year-Month-Day. |
| **Display Full Month Label** | Spells months out in full. Appears only when **Group** is Month or Year-Month.                                                     |

Use **Year-Month** for a monthly bookings chart spanning several years, so each month includes its year.

</details>

<details>

<summary>Measures, blank values and number formatting</summary>

| Setting                       | What it does                                                                                                                                                                                  |
| ----------------------------- | --------------------------------------------------------------------------------------------------------------------------------------------------------------------------------------------- |
| **Field**                     | The Salesforce field to aggregate. The settings offered after you select it depend on the chart type.                                                                                         |
| **Measures**                  | The aggregation: Average, Count, Maximum, Median, Minimum, Sum, Unique, First, or Last. Count and Unique work on any field; the others are offered only for a number field.                   |
| **Treat Blank Value As Zero** | Counts a record whose value is blank as zero in the measure. Off by default, so blank values are left out: a Count skips them, an Average does not divide by them and a Minimum ignores them. |
| **Format Style**              | How the result is displayed: Number, Number Rounded, Percent, Percent Rounded, Currency, Currency Rounded, or Custom.                                                                         |
| **Format**                    | A format pattern of your own. Appears only when **Format Style** is Custom.                                                                                                                   |
| **Multiplier**                | An optional multiplier applied to the aggregated value. Default: 1.                                                                                                                           |

Combo **Y-Axis** entries offer **Measures**, **Treat Blank Value As Zero** and **Display As**. They do not offer **Format Style**, **Format** or **Multiplier**.

Use **Count** on a populated record ID field to count records. Use **Sum** on Amount to total money. With **Treat Blank Value As Zero** off, a missing Amount is excluded from an Average; turn it on only if a missing value should participate as zero.

</details>

### Content

Use this group for the chart type, titles and colors. See [Colors](#colors) for preset and custom palette setup.

<details>

<summary>Content properties</summary>

| Property               | What it does                                                                                                                                                                                                                                                                                                                       |
| ---------------------- | ---------------------------------------------------------------------------------------------------------------------------------------------------------------------------------------------------------------------------------------------------------------------------------------------------------------------------------- |
| **Type**               | The chart type chosen when you added the component. You can change it here at any time, to any of the 20 types: Area, Bar, Calendar Heatmap, Choropleth Map, Column, Combo, Donut, Flat Gauge, Funnel, Gauge, Heatmap, Line, Matrix, Metrics Radar, Pyramid, Stacked Bar, Stacked Column, Stacked Pyramid, Treemap, or Word Cloud. |
| **Title**              | A heading displayed at the top of the chart.                                                                                                                                                                                                                                                                                       |
| **Subtitle**           | Secondary text displayed below the title.                                                                                                                                                                                                                                                                                          |
| **Title Font Size**    | 10, 11, 12, 14, 16, 18, 20, 24, 32, 48, or 64. Default: 14.                                                                                                                                                                                                                                                                        |
| **Subtitle Font Size** | The same sizes as the title. Default: 12.                                                                                                                                                                                                                                                                                          |
| **Title Alignment**    | Left (default), Center, or Right. Aligns the title and subtitle together.                                                                                                                                                                                                                                                          |
| **X Title**            | Label for the horizontal axis.                                                                                                                                                                                                                                                                                                     |
| **Y Title**            | Label for the vertical axis.                                                                                                                                                                                                                                                                                                       |
| **Axis Title**         | Label for the Calendar Heatmap's single axis. Replaces **X Title** and **Y Title**, which the Calendar Heatmap does not offer. Calendar Heatmap only.                                                                                                                                                                              |
| **Palette**            | A named color scheme. Custom Palette overrides it when at least one valid custom color is present.                                                                                                                                                                                                                                 |

</details>

### Chart

Only settings supported by the selected chart type appear. Expand the group you are configuring.

<details>

<summary>Bar, column and pyramid charts</summary>

| Property             | What it does                                                                                                                                                                                                |
| -------------------- | ----------------------------------------------------------------------------------------------------------------------------------------------------------------------------------------------------------- |
| **Show Values**      | Displays the numeric value on each bar, column or segment. Donut, Funnel and Treemap charts have it too.                                                                                                    |
| **Show Labels**      | Prints the category name inside each treemap rectangle and on each donut segment, above its value or percentage. A donut segment too small for its text shows none. Off by default. Treemap and Donut only. |
| **Normalize Values** | Normalizes stacked values so each stack sums to 100%, which makes proportions easy to compare. Stacked types only.                                                                                          |
| **Axis Mode**        | Arranges multiple series: Single Axis (default), Dual Axis, or Small Multiples. Area, Line, Combo and Metrics Radar have it too.                                                                            |

</details>

<details>

<summary>Donut charts</summary>

| Property                               | What it does                                                                                                                     |
| -------------------------------------- | -------------------------------------------------------------------------------------------------------------------------------- |
| **Donut Center Size**                  | The size of the hollow center, from 0% to 100% in steps of 10. Default: 60%.                                                     |
| **Show Percentages**                   | Labels each slice with its percentage of the total. Funnel and Treemap charts have it too.                                       |
| **Show Total**                         | Displays the total in the center of the donut. Heatmap, Treemap, Matrix, Calendar Heatmap and Choropleth Map charts have it too. |
| **Total Font Size**                    | Default, or 10 to 64. Requires **Show Total**.                                                                                   |
| **Combine Small Groups into "Others"** | Merges the small slices into a single "Others" slice. Funnel charts have it too.                                                 |
| **Donut Section Spacing**              | The gap between sections, in degrees, from 0 (default) to 10.                                                                    |

</details>

<details>

<summary>Gauge charts</summary>

| Property                 | What it does                                                     |
| ------------------------ | ---------------------------------------------------------------- |
| **Show Band Value**      | Shows the numeric value on the band.                             |
| **Show Band Percentage** | Shows the percentage on the band.                                |
| **Show Band Range**      | Shows the minimum and maximum below the gauge.                   |
| **Show Band Label**      | Shows text labels on the colored bands.                          |
| **Gauge Angle**          | The sweep of the dial: 90°, 120°, 180°, 240° (default), or 270°. |
| **Gauge Indicator Type** | The pointer drawn against the dial: Needle (default) or Circle.  |
| **Hide Tick Values**     | Hides the numbers printed around the dial.                       |

</details>

<details>

<summary>Area, line, combo and radar charts</summary>

| Property                       | What it does                                                                      |
| ------------------------------ | --------------------------------------------------------------------------------- |
| **Show Points**                | Draws a dot at each data point.                                                   |
| **Show Values in Chart Lines** | Shows the numeric value at each data point. Area, Line and Combo only.            |
| **Fill Opacity**               | How opaque the filled band under the line is, from 0 to 1. Default: 1. Area only. |

</details>

<details>

<summary>Heatmap and matrix charts</summary>

| Property                 | What it does                                                                                                 |
| ------------------------ | ------------------------------------------------------------------------------------------------------------ |
| **Show Values in Cells** | Prints each cell's value inside the cell instead of leaving the color to carry it alone.                     |
| **Show Empty Values**    | Also prints a value in cells with no data, instead of leaving them blank. Requires **Show Values in Cells**. |

</details>

<details>

<summary>Funnel charts</summary>

Funnel charts get their own **Funnel Type** group, which decides how the funnel is drawn.

| Property                           | What it does                                                                                                           |
| ---------------------------------- | ---------------------------------------------------------------------------------------------------------------------- |
| **Type**                           | **Default** draws a tapering funnel; **Bars** draws one bar per stage with connectors between them.                    |
| **Hide Connectors**                | Removes the connecting shapes between the bars. Requires **Type** = Bars.                                              |
| **Number of Items in Funnel Neck** | How many of the last stages are drawn as a straight neck rather than a taper. Default: 0. Requires **Type** = Default. |
| **Equal Segment Heights**          | Gives every stage the same height, so the width alone carries the value. Requires **Type** = Default.                  |
| **Dynamic Slopes**                 | Slopes each stage by its own drop-off instead of tapering evenly. Requires **Type** = Default.                         |

</details>

<details>

<summary>Flat gauge charts</summary>

Flat Gauge charts get their own **Flat Gauge Type** group, which decides how the bar is drawn.

| Property             | What it does                                                                                                                                                                     |
| -------------------- | -------------------------------------------------------------------------------------------------------------------------------------------------------------------------------- |
| **Type**             | Continuous (default) draws one solid bar, Discrete breaks it into steps, and Tiered colors it by the tier the value falls in.                                                    |
| **Number of Steps**  | How many steps a discrete gauge is cut into. Default: 5. Requires **Type** = Discrete. Too high a number and the steps stop being visible.                                       |
| **Flat Gauge Tiers** | The tiers themselves, each with a **Label**, a **Percentage** of the max range, and a **Color**. Requires **Type** = Tiered. For full coverage the percentages should total 100. |

Tiers color the filled part of the gauge only. They are not drawn as background bands behind the unfilled remainder.

<figure><img src="https://2532358799-files.gitbook.io/~/files/v0/b/gitbook-x-prod.appspot.com/o/spaces%2FODPvvv7Cx9Z9RECLn3oV%2Fuploads%2FCWZyWJ0H2Lzrw64W18ya%2Fchart-flat-gauge-types.png?alt=media" alt="The three Flat Gauge Type variants"><figcaption><p>The same value drawn as a Continuous, a Discrete and a Tiered flat gauge</p></figcaption></figure>

[View the Flat Gauge variants at full size](https://2532358799-files.gitbook.io/~/files/v0/b/gitbook-x-prod.appspot.com/o/spaces%2FODPvvv7Cx9Z9RECLn3oV%2Fuploads%2FCWZyWJ0H2Lzrw64W18ya%2Fchart-flat-gauge-types.png?alt=media)

</details>

### Words Configuration

Word Cloud only. Configure the mapping first using the [account industries example](#word-cloud-show-the-most-common-account-industries).

<details>

<summary>Word orientation and font sizes</summary>

| Property                     | What it does                                                                                                                                                                       |
| ---------------------------- | ---------------------------------------------------------------------------------------------------------------------------------------------------------------------------------- |
| **Word Orientation**         | Horizontal (default) keeps every word horizontal. Horizontal and Vertical turns about half of the words vertically.                                                                |
| **Fit All Words**            | Chooses font sizes automatically and tries smaller sizes to fit the labels. Some labels can still be omitted if space runs out. When on, the two font sizes below are not offered. |
| **Word Cloud Min Font Size** | The font size, in pixels, of the word with the smallest value. Default: 12. Requires **Fit All Words** to be off.                                                                  |
| **Word Cloud Max Font Size** | The font size, in pixels, of the word with the largest value. Default: 64, and never more than a quarter of the chart height. Requires **Fit All Words** to be off.                |

With **Fit All Words** off, words that cannot fit at their font size are omitted.

</details>

### Map

Choropleth Map only. See the [province example](#choropleth-map-count-accounts-by-province) for the difference between Map settings and the Region mapping.

<details>

<summary>Map properties</summary>

| Property                             | What it does                                                                                                                                                                                                                                                  |
| ------------------------------------ | ------------------------------------------------------------------------------------------------------------------------------------------------------------------------------------------------------------------------------------------------------------- |
| **Type**                             | The map to draw: World (default), Continent, Country, or Custom.                                                                                                                                                                                              |
| **Regions**                          | The regions to include, one entry per name. For a Continent map, enter continent names, for example Europe; for a Country map, enter country names. Requires **Type** = Continent or Country. If no name matches, the chart shows a message instead of a map. |
| **Map Separations**                  | The finest boundaries drawn: Continent, Country (default), or State/Province. Requires **Type** = World, Continent or Country.                                                                                                                                |
| **Custom Map**                       | The URL, or the content document ID, of the map to draw. It must be a GeoJSON or a TopoJSON file, and a URL has to be added to the trusted URLs of the org. A content document must be a `.json` file. Requires **Type** = Custom.                            |
| **Custom Map Feature Name Property** | The property of the custom map's features that holds the region name. Default: `name`. Requires **Type** = Custom. Available under advanced options.                                                                                                          |
| **Enable Zoom on Map**               | Lets users zoom the map with Ctrl or Cmd and the mouse wheel, and pan it by dragging. Off by default.                                                                                                                                                         |

If a custom map cannot load or is not valid GeoJSON or TopoJSON, an error appears above the map area.

</details>

### Range Values

Gauge and Flat Gauge only. Set a minimum and maximum appropriate to the value you are measuring. A pipeline amount and a percentage need different scales.

<details>

<summary>Fixed values and queried ranges</summary>

| Property           | What it does                                                                                                  |
| ------------------ | ------------------------------------------------------------------------------------------------------------- |
| **Min range**      | The bottom of the scale. Default: 0. In query mode, it is derived from an aggregate over a Salesforce object. |
| **Max Range**      | The top of the scale. Default: 100. In query mode, it is derived from an aggregate over a Salesforce object.  |
| **Show Min Range** | Displays the minimum as a label.                                                                              |
| **Show Max Range** | Displays the maximum as a label.                                                                              |

In query mode, **Min range** and **Max Range** each run an aggregate over a Salesforce object, so the scale follows your data. A number, currency or percent field offers **Sum**, **Average**, **Count**, **Count Distinct**, **Maximum** and **Minimum**; every other field type offers the last four only. Set **Query Refresh Emp Channel Name** to a platform event to recompute the value whenever an event is published on that channel.

</details>

### Axis

<details>

<summary>Axis settings</summary>

The Axis group applies to the Calendar Heatmap, which has one axis rather than an X and a Y.

| Property            | What it does                            |
| ------------------- | --------------------------------------- |
| **Hide Axis**       | Hides the axis line and its tick marks. |
| **Hide Axis Title** | Hides the label set in **Axis Title**.  |

</details>

### X-Axis

<details>

<summary>X-Axis settings</summary>

Axis-based types only: Area, Bar, Stacked Bar, Column, Stacked Column, Line, Pyramid, Stacked Pyramid, Combo and Metrics Radar.

| Property         | What it does                                                                                                |
| ---------------- | ----------------------------------------------------------------------------------------------------------- |
| **Hide X Axis**  | Hides the horizontal axis line and its tick marks.                                                          |
| **Hide X Title** | Hides the label set in **X Title**, leaving the axis itself visible. Heatmap and Matrix charts have it too. |

</details>

### Y-Axis

<details>

<summary>Y-Axis settings</summary>

The same axis-based types as **X-Axis**.

| Property          | What it does                                                                                                                        |
| ----------------- | ----------------------------------------------------------------------------------------------------------------------------------- |
| **Hide Y Axis**   | Hides the vertical axis line and its tick marks.                                                                                    |
| **Hide Y Title**  | Hides the label set in **Y Title**, leaving the axis itself visible. Heatmap and Matrix charts have it too.                         |
| **Use Log Scale** | Puts the vertical axis on a logarithmic scale instead of a linear one, which helps when the data spans several orders of magnitude. |

</details>

### Legend

<details>

<summary>Legend settings</summary>

Turn **Show Legend** on to display a key matching each color to its series. The settings below only apply once it is on. This group is not offered for Choropleth Map and Word Cloud charts.

| Property                      | What it does                                                                                                         |
| ----------------------------- | -------------------------------------------------------------------------------------------------------------------- |
| **Position**                  | Where the legend sits: Left, Right (default), Top, or Bottom.                                                        |
| **Show Header**               | Adds a title above the legend.                                                                                       |
| **Display Inside Chart Area** | Places the legend inside the chart rather than beside it, which buys space when the chart is cramped.                |
| **Reverse Item Order**        | Reverses the order of the legend entries.                                                                            |
| **Item Order**                | Comma-separated legend labels, in display order. Unlisted labels follow. Overrides Reverse Item Order in the legend. |

{% hint style="info" %}
**Item Order** only changes the order of the legend entries: the chart's sections and colors stay the same.
{% endhint %}

</details>

### Tooltip

<details>

<summary>Tooltip settings</summary>

Controls what appears when a user hovers over a chart element. Available for every type except Gauge and Flat Gauge.

| Property                    | What it does                                                |
| --------------------------- | ----------------------------------------------------------- |
| **Tooltip Show Dimensions** | Shows the grouping value, for example "Stage: Negotiation". |
| **Tooltip Show Measures**   | Shows the numeric value, for example "Amount: $50,000".     |
| **Tooltip Show Percentage** | Shows the percentage contribution.                          |

</details>

### No Results Message

<details>

<summary>No Results Message settings</summary>

The **No Results Message** group controls what the chart shows when its data source returns no records, instead of rendering an empty plot area.

| Setting                     | Description                                          |
| --------------------------- | ---------------------------------------------------- |
| **No Results Message**      | The message to display when no records are returned. |
| **Hide No Results Image**   | If enabled, the no results illustration is hidden.   |
| **Hide No Results Message** | If enabled, the no results message is hidden.        |

</details>

### Set Component Visibility

All components support conditional visibility. See [Component Visibility](https://docs.avonnicomponents.com/dynamic-components/core-concepts/component-visibility.md).

## Colors

Open **Edit Chart > Properties > Content** to choose the chart's colors.

| You want                  | Use                                                     |
| ------------------------- | ------------------------------------------------------- |
| A ready-made color scheme | **Palette**, for example Ocean                          |
| An exact list of colors   | **Custom Palette**, for example `#0176d3` and `#f28b00` |

### Apply a preset palette

{% stepper %}
{% step %}

#### Select the preset

Open **Content > Palette** and select **Ocean**, or another preset.
{% endstep %}

{% step %}

#### Check for a custom override

If the chart still uses custom colors, clear **Custom Palette**. A valid custom color list takes priority over **Palette**.
{% endstep %}
{% endstepper %}

<details>

<summary>Available presets and variable values</summary>

The presets are **Aurora** (default), **Nightfall**, **Wildflowers**, **Sunrise**, **Bluegrass**, **Ocean**, **Heat**, **Dusk**, **Pond**, **Watermelon**, **Fire**, **Water**, **Lake**, **Mineral** and **Extension**.

For a runtime preset, switch **Palette** to variable mode and bind a page variable or a Salesforce record field. Its value must be a preset name.

| Bound value                    | Result                                                     |
| ------------------------------ | ---------------------------------------------------------- |
| `Ocean` or `ocean`             | Ocean palette                                              |
| Empty value or an unknown name | Aurora palette                                             |
| `#0176d3` or `red`             | Aurora palette; individual colors belong in Custom Palette |

</details>

### Set exact colors with Custom Palette

**Example:** make the Combo chart's first measure blue and its second measure orange.

<figure><img src="https://2532358799-files.gitbook.io/~/files/v0/b/gitbook-x-prod.appspot.com/o/spaces%2FODPvvv7Cx9Z9RECLn3oV%2Fuploads%2FYtLINQGkFqunAC534X1F%2Fchart-custom-palette.jpg?alt=media" alt="Combo preview beside Custom Palette with blue #0176d3 followed by orange #f28b00"><figcaption><p>Builder preview: the first custom color draws Amount-sum, and the second draws Amount-average. The list overrides the Aurora preset.</p></figcaption></figure>

[View this capture at full size](https://2532358799-files.gitbook.io/~/files/v0/b/gitbook-x-prod.appspot.com/o/spaces%2FODPvvv7Cx9Z9RECLn3oV%2Fuploads%2FYtLINQGkFqunAC534X1F%2Fchart-custom-palette.jpg?alt=media)

{% stepper %}
{% step %}

#### Add the colors

Open **Content > Custom Palette**. Click **Add Item** for each color. Use the color picker or type the hex value.

| List position | Color     | Applied to the Combo example          |
| ------------- | --------- | ------------------------------------- |
| 1             | `#0176d3` | The first series, total open pipeline |
| 2             | `#f28b00` | The second series, average deal size  |
| {% endstep %} |           |                                       |

{% step %}

#### Check the order

The first color goes to the first series, the second to the second series. Drag the handle on the left of a color row to change that order. Use **×** on the right to remove a row.

Colors follow series order. This list does not bind a color to a label such as `Closed Won`. Recheck the result if the series or category order changes. Reordering the legend with **Item Order** does not change the chart's color assignment.
{% endstep %}

{% step %}

#### Check every series

For the Combo example, confirm that the total is blue and the average is orange. For a Donut or Stacked Column chart, provide enough colors to distinguish the displayed slices or series.

| Color list                      | Result                                            |
| ------------------------------- | ------------------------------------------------- |
| One color for several series    | Every series uses that color                      |
| Two colors for three series     | First color, second color, then first color again |
| At least one valid custom color | Custom Palette overrides Palette                  |
| No valid custom colors          | The chart uses Palette                            |
| Gauge or Flat Gauge             | The chart uses the first custom color             |
| {% endstep %}                   |                                                   |
| {% endstepper %}                |                                                   |

<details>

<summary>Accepted color values and runtime color lists</summary>

Enter hex values as `#RRGGBB`, such as `#0176d3`, or `#RRGGBBAA`, such as `#0176d3ff`. The chart uses the listed colors directly; it does not generate lighter or darker shades. Invalid entries are dropped.

To change the list at runtime:

{% stepper %}
{% step %}

#### Create the color collection

Create a **Text Collection** page variable, for example `ChartColors`. Put each hex color in a separate collection item: `#0176d3`, then `#f28b00`.

Use a collection of color strings, not one string containing a comma-separated list.
{% endstep %}

{% step %}

#### Bind Custom Palette

Switch **Custom Palette** to variable mode and select that collection.
{% endstep %}
{% endstepper %}

</details>

## Styling

Open **Edit Chart > Style**. These controls affect the component's layout and appearance. Series colors are configured under **Properties > Content**.

| Style group       | Use it to...                                   |
| ----------------- | ---------------------------------------------- |
| Margin            | Adjust the outer space on each side            |
| Padding           | Adjust space between the chart and its border  |
| Size              | Set width, height, size limits and overflow    |
| Border            | Set the border's color, size, style and radius |
| Gauge Chart Style | Set Circle Indicator Color when Type is Gauge  |
| Word Cloud Style  | Set Font Family when Type is Word Cloud        |

<details>

<summary>Size and overflow controls</summary>

| Control                                             | Use it to                                        |
| --------------------------------------------------- | ------------------------------------------------ |
| **Width / Height**                                  | Set the chart's dimensions.                      |
| **Min Width / Max Width / Min Height / Max Height** | Set size limits.                                 |
| **Overflow**                                        | Choose how content beyond the bounds is handled. |
| **Overflow X / Overflow Y**                         | Configure overflow for each axis.                |

</details>

## Use Cases

### Quick Start: Opportunity Pipeline Chart

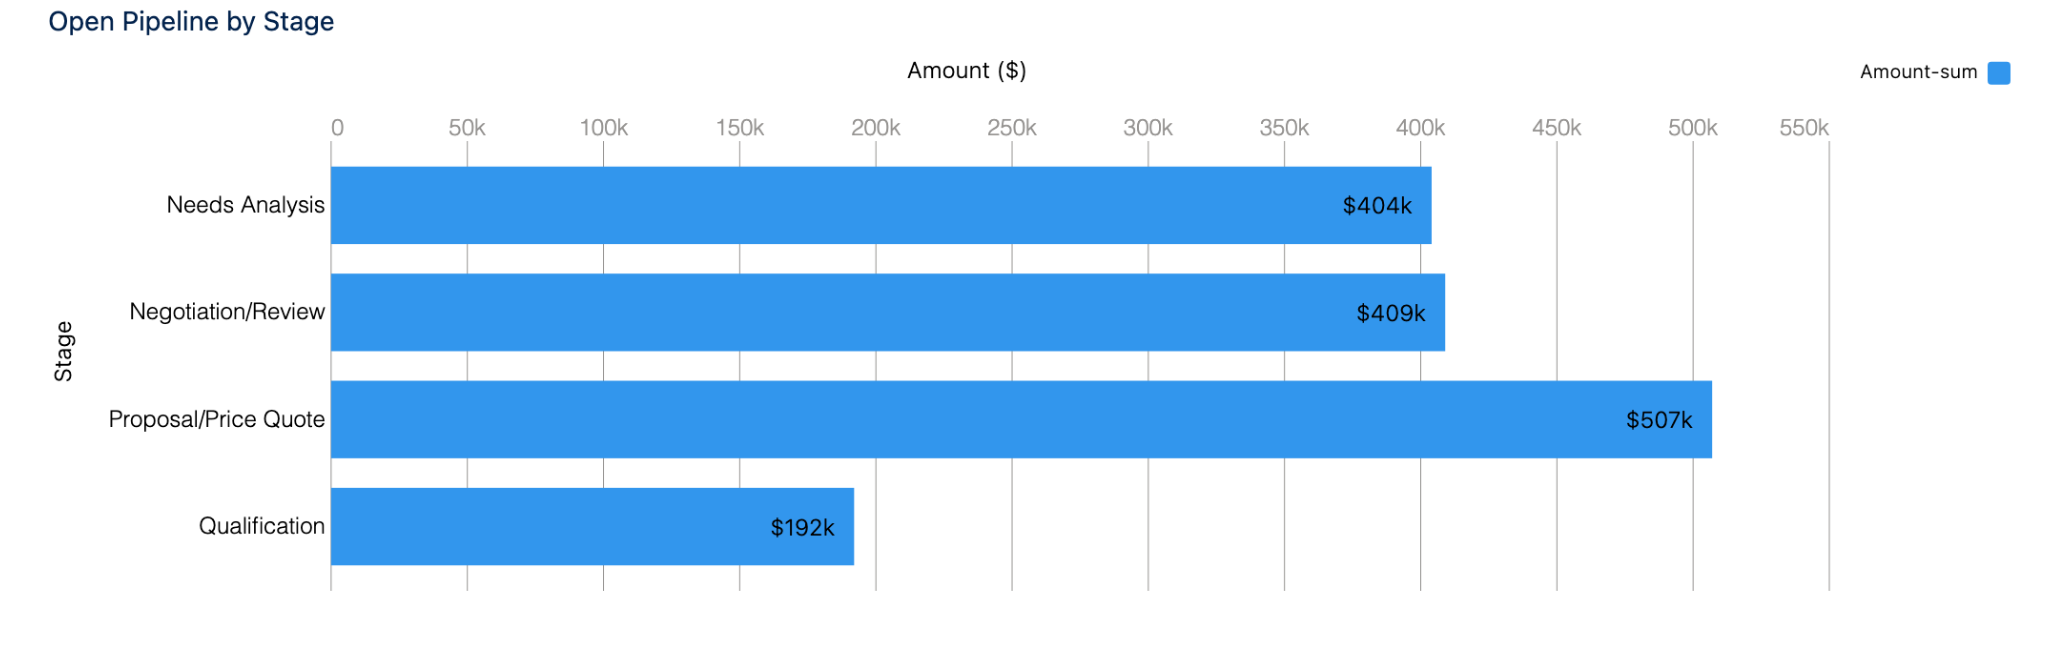
**Build:** one horizontal bar per open opportunity stage, showing the sum of Amount.

**Before you start:** use an org where you can read Opportunity records with Stage and Amount values. The API names below help you identify the fields; the picker can show their Salesforce labels.

<figure><img src="https://2532358799-files.gitbook.io/~/files/v0/b/gitbook-x-prod.appspot.com/o/spaces%2FODPvvv7Cx9Z9RECLn3oV%2Fuploads%2Fca7zbVryGBML5Ng6fdTx%2Fchart-example-bar.png?alt=media" alt="A bar chart of open pipeline by stage"><figcaption><p>Product capture: open opportunities grouped by Stage, with Amount summed for each stage. Your totals depend on your records.</p></figcaption></figure>

[View the pipeline chart at full size](https://2532358799-files.gitbook.io/~/files/v0/b/gitbook-x-prod.appspot.com/o/spaces%2FODPvvv7Cx9Z9RECLn3oV%2Fuploads%2Fca7zbVryGBML5Ng6fdTx%2Fchart-example-bar.png?alt=media)

{% stepper %}
{% step %}

#### Add the chart and choose Bar

Add a Chart to your Dynamic Component and select it on the canvas. In **Edit Chart > Properties > Content**, set **Type** to **Bar**.
{% endstep %}

{% step %}

#### Connect the open opportunities

Open **Properties > Data Source** and select **Query**. Select or create an Opportunity query in **Records**. Use **Edit the query** to change an existing query.

| Query setting | Value              |
| ------------- | ------------------ |
| Object        | Opportunity        |
| Filter        | `IsClosed = false` |

This filter limits the chart to open opportunities. Use the same filter when you check the totals in a Salesforce report.
{% endstep %}

{% step %}

#### Map the stage and amount

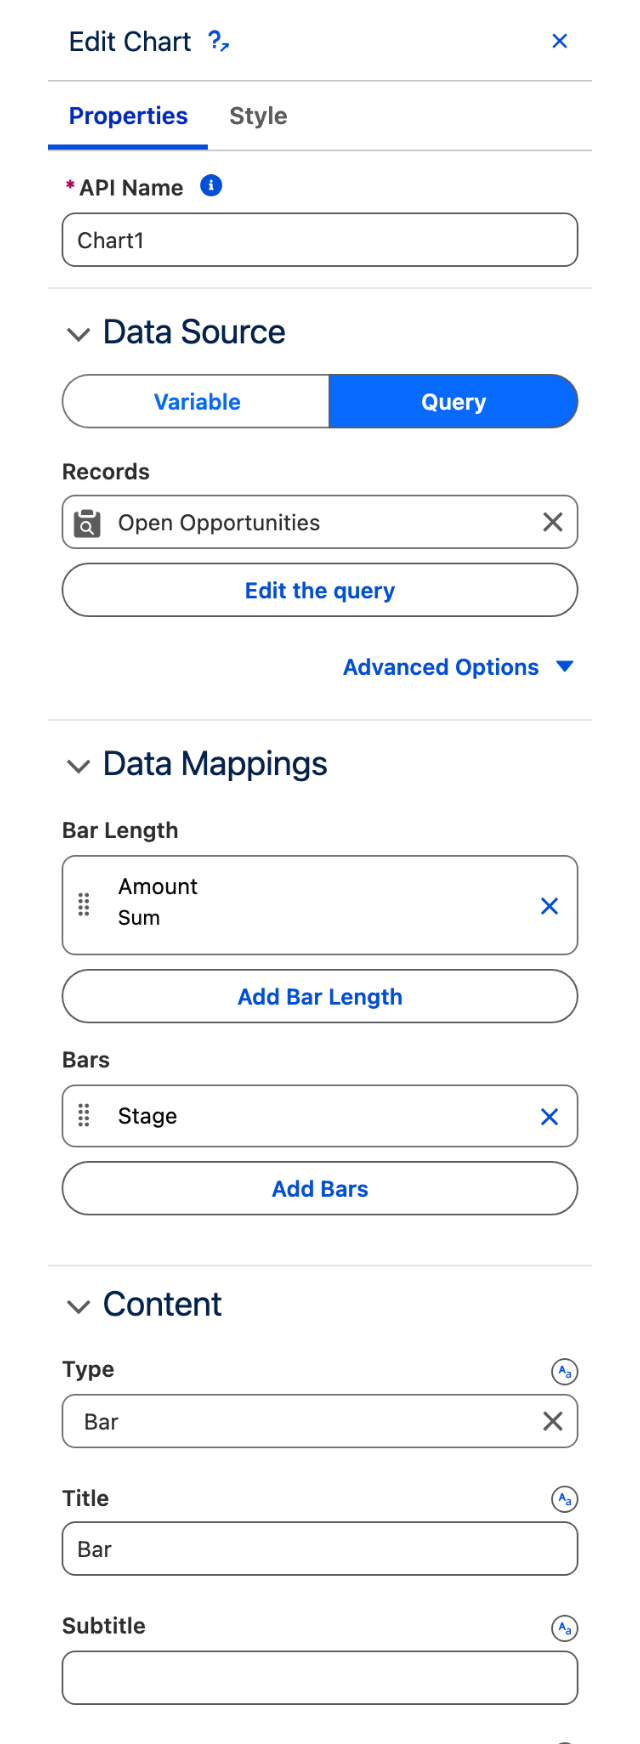
Open **Properties > Data Mappings**. Click **Add Bars** for the grouping and **Add Bar Length** for the value.

| Setting                   | Value               |
| ------------------------- | ------------------- |
| Bars > Field              | Stage (`StageName`) |
| Bar Length > Field        | Amount (`Amount`)   |
| Bar Length > Measures     | Sum                 |
| Bar Length > Format Style | Currency Rounded    |

Leave **Group** unset for Stage. Date grouping is only needed when the grouping field is a date.

<figure><img src="https://2532358799-files.gitbook.io/~/files/v0/b/gitbook-x-prod.appspot.com/o/spaces%2FODPvvv7Cx9Z9RECLn3oV%2Fuploads%2FG4ZrmnhHVSDnNhJGVrMX%2Fchart-builder-properties.png?alt=media" alt="Edit Chart panel with Query selected, Amount and Sum in Bar Length, and Stage in Bars" width="320"><figcaption><p>Configure the records in Data Source, then use Add Bar Length and Add Bars to map the fields. Salesforce field labels appear in the picker.</p></figcaption></figure>

[View the mapping panel at full size](https://2532358799-files.gitbook.io/~/files/v0/b/gitbook-x-prod.appspot.com/o/spaces%2FODPvvv7Cx9Z9RECLn3oV%2Fuploads%2FG4ZrmnhHVSDnNhJGVrMX%2Fchart-builder-properties.png?alt=media)
{% endstep %}

{% step %}

#### Label the chart and check the result

In **Content**, set **Title** to `Open Pipeline by Stage`, **X Title** to `Amount ($)` and **Y Title** to `Stage`. Use an axis label that matches your data's currency.

In **Chart**, turn on **Show Values**. Turn on **Show Legend** if you want the measure displayed beside the plot.

**Check:** each displayed stage has one bar. Its value matches the sum of Amount for the open opportunities in that stage. Closed opportunities are excluded.
{% endstep %}
{% endstepper %}

### Pipeline Share by Lead Source

**Build:** a donut showing each lead source's share of open pipeline. This uses the same open Opportunity query as the quick start.

{% stepper %}
{% step %}

#### Choose Donut

Select the Chart. In **Properties > Content**, set **Type** to **Donut**. Keep the open Opportunity query.
{% endstep %}

{% step %}

#### Map the source and amount

Open **Data Mappings**. The slots now read **Sliced By** and **Value**. Set the entries below.

| Mapping       | Field                      | Measures       |
| ------------- | -------------------------- | -------------- |
| Sliced By     | Lead Source (`LeadSource`) | Not applicable |
| Value         | Amount (`Amount`)          | Sum            |
| {% endstep %} |                            |                |

{% step %}

#### Show the shares and check the total

In **Chart**, turn on **Show Total** and **Show Percentages**. Leave **Donut Center Size** at `60%` and turn on **Show Legend**.

In **Content**, set **Title** to `Open pipeline by lead source` and **Palette** to **Ocean**. Clear **Custom Palette** if a custom list is overriding the preset.

**Check:** the center total matches the total open pipeline from the bar chart when both use the same records. Each slice represents one lead source. If small sources appear as one slice, check **Combine Small Groups into "Others"**.
{% endstep %}
{% endstepper %}

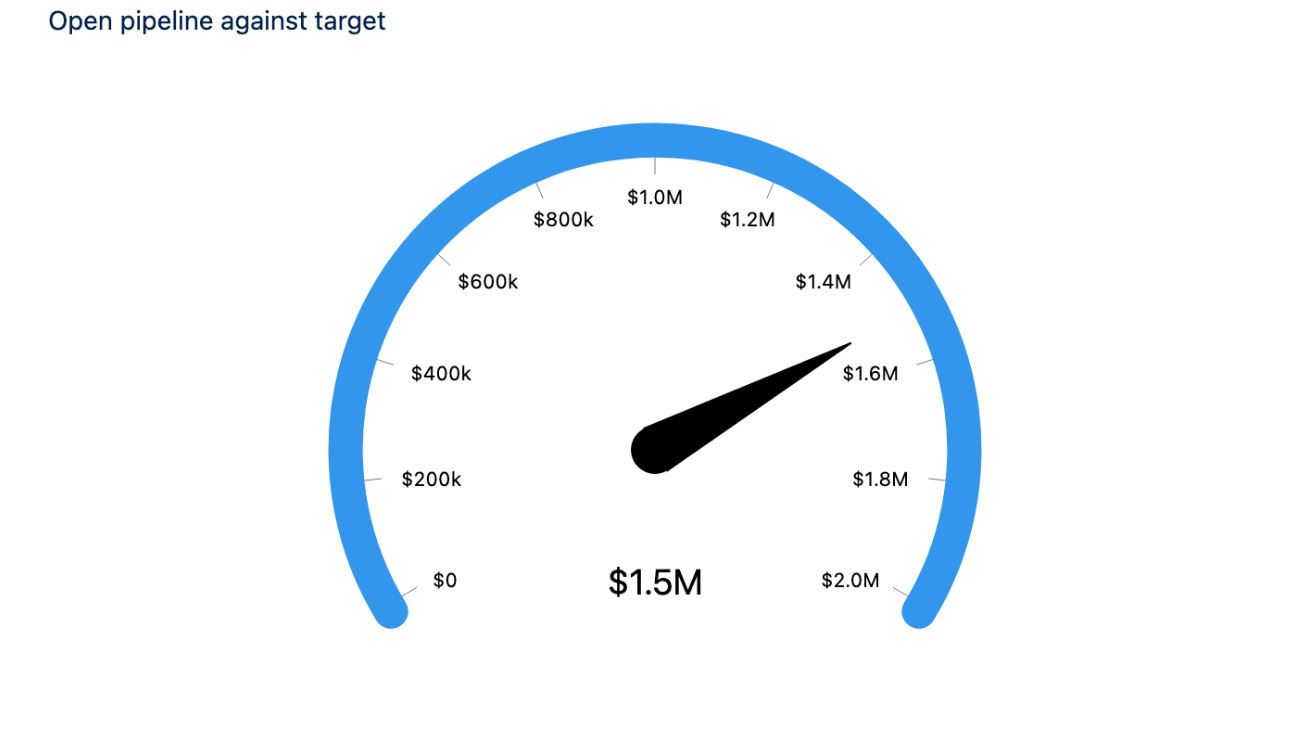
### Open Pipeline Against a Target

**Build:** a gauge showing total open pipeline against a fixed target of 2,000,000.

{% stepper %}
{% step %}

#### Choose Gauge and map the value

Keep the open Opportunity query and set **Properties > Content > Type** to **Gauge**.

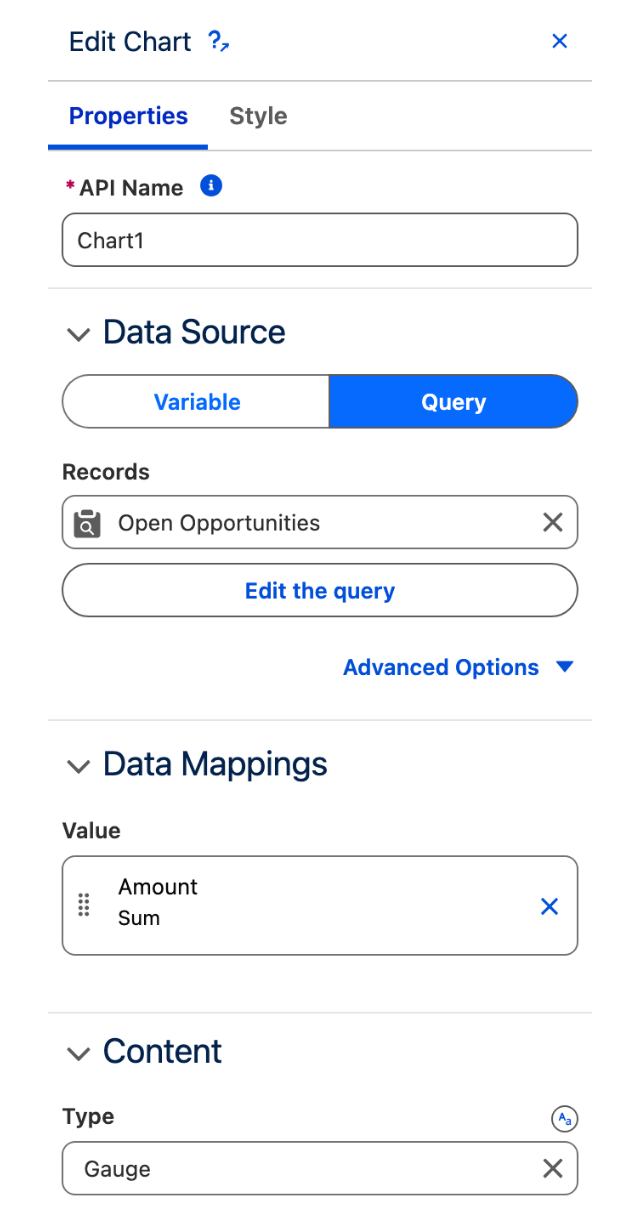
In **Data Mappings > Value**, set **Field** to Amount (`Amount`) and **Measures** to **Sum**.

<figure><img src="https://2532358799-files.gitbook.io/~/files/v0/b/gitbook-x-prod.appspot.com/o/spaces%2FODPvvv7Cx9Z9RECLn3oV%2Fuploads%2F5eoy6x6OnV7IxnXFnc5R%2Fchart-example-gauge-panel.png?alt=media" alt="The Chart panel on a gauge, showing a single Value mapping slot" width="320"><figcaption><p>A Gauge has a Value mapping. It does not need a category field.</p></figcaption></figure>

[View the Gauge panel at full size](https://2532358799-files.gitbook.io/~/files/v0/b/gitbook-x-prod.appspot.com/o/spaces%2FODPvvv7Cx9Z9RECLn3oV%2Fuploads%2F5eoy6x6OnV7IxnXFnc5R%2Fchart-example-gauge-panel.png?alt=media)
{% endstep %}

{% step %}

#### Set the target and show the amount

In **Range Values**, enter a fixed **Min range** of `0` and **Max Range** of `2000000`.

Turn on **Show Band Value** in **Chart**. In **Content**, set **Title** to `Open pipeline against target`.

<figure><img src="https://2532358799-files.gitbook.io/~/files/v0/b/gitbook-x-prod.appspot.com/o/spaces%2FODPvvv7Cx9Z9RECLn3oV%2Fuploads%2F8T18tVS9WlWlyEQsKO2V%2Fchart-example-gauge.png?alt=media" alt="A gauge chart of open pipeline against a target"><figcaption><p>Product capture: about 1.5M of open pipeline against a fixed 2M target.</p></figcaption></figure>

[View the Gauge at full size](https://2532358799-files.gitbook.io/~/files/v0/b/gitbook-x-prod.appspot.com/o/spaces%2FODPvvv7Cx9Z9RECLn3oV%2Fuploads%2F8T18tVS9WlWlyEQsKO2V%2Fchart-example-gauge.png?alt=media)
{% endstep %}

{% step %}

#### Check the range and total

**Check:** the value matches the total open pipeline. The maximum is your target, not the largest opportunity. If you choose a query for a range value instead of a fixed number, check that range query separately.
{% endstep %}
{% endstepper %}

## More Chart Examples

The Combo, map and Word Cloud captures show the Builder preview with sample records. Check your own records and filters before using the result on a Lightning Page.

### Combo: compare total and average deal amounts

**Build:** bars for total open pipeline and a line for average deal size, grouped by stage. Both measures use Amount, so both are in the same currency.

Use the open Opportunity query from the quick start.

<figure><img src="https://2532358799-files.gitbook.io/~/files/v0/b/gitbook-x-prod.appspot.com/o/spaces%2FODPvvv7Cx9Z9RECLn3oV%2Fuploads%2FVFrObD4Iq6oFuAAhg3CS%2Fchart-combo-result.jpg?alt=media" alt="Combo chart preview with blue total Amount bars and an orange average Amount line by stage"><figcaption><p>Builder preview using sample opportunities. Needs Analysis totals 40,000 with an average of 20,000; closed opportunities are excluded.</p></figcaption></figure>

[View this capture at full size](https://2532358799-files.gitbook.io/~/files/v0/b/gitbook-x-prod.appspot.com/o/spaces%2FODPvvv7Cx9Z9RECLn3oV%2Fuploads%2FVFrObD4Iq6oFuAAhg3CS%2Fchart-combo-result.jpg?alt=media)

{% stepper %}
{% step %}

#### Choose Combo and group by stage

In **Edit Chart > Properties > Content**, set **Type** to **Combo**.

Open **Data Mappings > X-Axis** and add Stage (`StageName`) as the **Field**. Leave **Group** unset.

In **Style > Size**, set **Height** to `400 px` so the plot has enough room for its bars, line and axis labels. The capture uses a `760 px` wide chart. Return to **Properties** to add the measures.
{% endstep %}

{% step %}

#### Add a Y-Axis entry for each measure

In **Data Mappings > Y-Axis**, add two entries. For both, set **Field** to Amount.

| Y-Axis entry               | Measures | Display As |
| -------------------------- | -------- | ---------- |
| First: total open pipeline | Sum      | Bar        |
| Second: average deal size  | Average  | Line       |

**Display As** belongs to each Y-Axis entry. Change it there to draw that entry as a **Line**, **Bar** or **Dot**. The X-Axis still defines the categories shared by the entries.

<figure><img src="https://2532358799-files.gitbook.io/~/files/v0/b/gitbook-x-prod.appspot.com/o/spaces%2FODPvvv7Cx9Z9RECLn3oV%2Fuploads%2F2sSsGZLCzcXiN78H3ywG%2Fchart-combo-y-axis.jpg?alt=media" alt="Combo Y-Axis entry with Amount, Average and Display As Line" width="480"><figcaption><p>Open a Y-Axis row to set its measure and Display As. This second Amount entry draws the average as a line.</p></figcaption></figure>

[View this capture at full size](https://2532358799-files.gitbook.io/~/files/v0/b/gitbook-x-prod.appspot.com/o/spaces%2FODPvvv7Cx9Z9RECLn3oV%2Fuploads%2F2sSsGZLCzcXiN78H3ywG%2Fchart-combo-y-axis.jpg?alt=media)
{% endstep %}

{% step %}

#### Check one stage

For one stage, compare the bar with the sum of Amount and the line with its average. Leave **Treat Blank Value As Zero** off if records without an Amount should be excluded from the average.

Sample check: Amount values of `10000` and `30000` should give a total of `40000` and an average of `20000`.
{% endstep %}
{% endstepper %}

### Choropleth Map: count accounts by province

**Build:** a map of Canada shaded by the number of accounts in each province.

**Before you start:** use Canadian Account records with Billing State/Province populated. Use full province names such as `Ontario`.

<figure><img src="https://2532358799-files.gitbook.io/~/files/v0/b/gitbook-x-prod.appspot.com/o/spaces%2FODPvvv7Cx9Z9RECLn3oV%2Fuploads%2FmJJrHO1utc7WTKbPRmQs%2Fchart-map-result.jpg?alt=media" alt="Canada map preview shaded by Account count, with a total of 20 sample Accounts"><figcaption><p>Builder preview using 20 sample Accounts. Ontario has 8 accounts and Québec has 4. Your totals depend on your records and filters.</p></figcaption></figure>

[View this capture at full size](https://2532358799-files.gitbook.io/~/files/v0/b/gitbook-x-prod.appspot.com/o/spaces%2FODPvvv7Cx9Z9RECLn3oV%2Fuploads%2FmJJrHO1utc7WTKbPRmQs%2Fchart-map-result.jpg?alt=media)

{% stepper %}
{% step %}

#### Choose the chart and connect the accounts

Set **Edit Chart > Properties > Content > Type** to **Choropleth Map**.

In **Data Source**, select **Query** and choose or create an Account query. Filter it to the Canadian accounts you want to include. Exclude records with no Billing State/Province if they should not contribute.

In **Style > Size**, set **Height** to `320 px` for a map like this capture. Return to **Properties**.
{% endstep %}

{% step %}

#### Choose Canada and its provinces

Open the **Map** group and set:

| Map setting     | Value                               |
| --------------- | ----------------------------------- |
| Type            | Country                             |
| Regions         | Click Add Item, then enter `Canada` |
| Map Separations | State/Province                      |

<figure><img src="https://2532358799-files.gitbook.io/~/files/v0/b/gitbook-x-prod.appspot.com/o/spaces%2FODPvvv7Cx9Z9RECLn3oV%2Fuploads%2Fr5uhbeeWkM38MLCDKy9I%2Fchart-map-settings.jpg?alt=media" alt="Map settings with Type Country, Regions Canada and Map Separations State/Province" width="320"><figcaption><p>Map chooses the geography to draw. Regions contains the country name, Canada.</p></figcaption></figure>

[View this capture at full size](https://2532358799-files.gitbook.io/~/files/v0/b/gitbook-x-prod.appspot.com/o/spaces%2FODPvvv7Cx9Z9RECLn3oV%2Fuploads%2Fr5uhbeeWkM38MLCDKy9I%2Fchart-map-settings.jpg?alt=media)
{% endstep %}

{% step %}

#### Match each account to a province

Open **Data Mappings > Region**. Add its single entry if empty, then click the row to edit it.

| Region entry setting | Value                                   |
| -------------------- | --------------------------------------- |
| Type                 | Region                                  |
| Region               | Billing State/Province (`BillingState`) |

Click **Save** in the entry popup.

<figure><img src="https://2532358799-files.gitbook.io/~/files/v0/b/gitbook-x-prod.appspot.com/o/spaces%2FODPvvv7Cx9Z9RECLn3oV%2Fuploads%2FocsJMnWg2kFvRS6ncV7Y%2Fchart-map-region.jpg?alt=media" alt="Region mapping popup with Type Region and Billing State/Province selected" width="480"><figcaption><p>Region mapping matches records to the map. Its Type is Region; Map > Type remains Country.</p></figcaption></figure>

[View this capture at full size](https://2532358799-files.gitbook.io/~/files/v0/b/gitbook-x-prod.appspot.com/o/spaces%2FODPvvv7Cx9Z9RECLn3oV%2Fuploads%2FocsJMnWg2kFvRS6ncV7Y%2Fchart-map-region.jpg?alt=media)

Names must match the map, ignoring capitalization. `ON` does not match `Ontario`. Accents matter too: this map uses `Québec`. Use the exact province names expected by the map when checking your records.
{% endstep %}

{% step %}

#### Count the accounts and check the result

In **Data Mappings > Value**, set **Field** to the account record ID (`Id`) and **Measures** to **Count**. Save the entry.

In **Chart**, turn on **Show Total**.

**Check:** compare a province's value with a Salesforce report counting the same accounts. All 20 sample accounts match a province in the capture. A lower total can indicate unmatched names; check the data before relying on the result.
{% endstep %}
{% endstepper %}

<details>

<summary>Use coordinates or a custom map</summary>

| Your records or map        | Configure this                                                                                                                                                                                                                           |
| -------------------------- | ---------------------------------------------------------------------------------------------------------------------------------------------------------------------------------------------------------------------------------------- |
| Records have coordinates   | In Data Mappings > Region, set Type to Geo Location and select Latitude and Longitude fields. Each record goes to the region containing that location.                                                                                   |
| You change Map Separations | Match the Region field to the new level: continent names, country names, or state and province names.                                                                                                                                    |
| You have a custom map      | Set Map > Type to Custom and provide a GeoJSON or TopoJSON file in Custom Map. Under Advanced Options, set Custom Map Feature Name Property to the property storing region names, such as `name`. Match the record field to those names. |

Geo Location needs coordinate fields, not an address string. For a custom map, a URL must be trusted in the org; a content document must be a `.json` file.

</details>

### Word Cloud: show the most common account industries

**Build:** one label per industry, sized by its number of accounts.

Use an Account query with **Industry** populated. Reuse the map's query to look at the same customer set.

<figure><img src="https://2532358799-files.gitbook.io/~/files/v0/b/gitbook-x-prod.appspot.com/o/spaces%2FODPvvv7Cx9Z9RECLn3oV%2Fuploads%2FA6L2cRgLTgrrZBzSIXIZ%2Fchart-word-cloud-result-compact.jpg?alt=media" alt="Account industry Word Cloud preview with Manufacturing largest and Retail smallest"><figcaption><p>Builder preview using the same 20 sample Accounts. Manufacturing has 8 records and Retail has 1; labels are horizontal.</p></figcaption></figure>

[View this capture at full size](https://2532358799-files.gitbook.io/~/files/v0/b/gitbook-x-prod.appspot.com/o/spaces%2FODPvvv7Cx9Z9RECLn3oV%2Fuploads%2FA6L2cRgLTgrrZBzSIXIZ%2Fchart-word-cloud-result-compact.jpg?alt=media)

{% stepper %}
{% step %}

#### Choose Word Cloud and connect the accounts

Set **Edit Chart > Properties > Content > Type** to **Word Cloud** and select the Account query in **Data Source**.

In **Style > Size**, set **Height** to `280 px` for this example, then return to **Properties**.
{% endstep %}

{% step %}

#### Choose the labels in Words

Open **Data Mappings > Words** and click **Add Words**. Set **Field** to `Industry`, the Account field used for the labels. Save the entry.

<figure><img src="https://2532358799-files.gitbook.io/~/files/v0/b/gitbook-x-prod.appspot.com/o/spaces%2FODPvvv7Cx9Z9RECLn3oV%2Fuploads%2FFHjyCIbc4KwL3pH4ANSh%2Fchart-words-field.jpg?alt=media" alt="Words entry with Field Industry beside Words and Word Size mappings" width="480"><figcaption><p>Words supplies the labels. Each distinct Industry value becomes one label.</p></figcaption></figure>

[View this capture at full size](https://2532358799-files.gitbook.io/~/files/v0/b/gitbook-x-prod.appspot.com/o/spaces%2FODPvvv7Cx9Z9RECLn3oV%2Fuploads%2FFHjyCIbc4KwL3pH4ANSh%2Fchart-words-field.jpg?alt=media)
{% endstep %}

{% step %}

#### Choose the size in Word Size

Open **Data Mappings > Word Size**. Set **Field** to the account record ID (`Id`) and **Measures** to **Count**, then save.

<figure><img src="https://2532358799-files.gitbook.io/~/files/v0/b/gitbook-x-prod.appspot.com/o/spaces%2FODPvvv7Cx9Z9RECLn3oV%2Fuploads%2FLDocqBJhEdpuwvqNpREi%2Fchart-word-size.jpg?alt=media" alt="Word Size entry with Field Id and Measures Count" width="480"><figcaption><p>Word Size supplies the calculation. Count on Id sizes each industry by its number of Account records.</p></figcaption></figure>

[View this capture at full size](https://2532358799-files.gitbook.io/~/files/v0/b/gitbook-x-prod.appspot.com/o/spaces%2FODPvvv7Cx9Z9RECLn3oV%2Fuploads%2FLDocqBJhEdpuwvqNpREi%2Fchart-word-size.jpg?alt=media)
{% endstep %}

{% step %}

#### Fit the words and check them

In **Words Configuration**, turn on **Fit All Words** and set **Word Orientation** to **Horizontal**.

**Check:** the most common industry should have the largest label. In this sample, Manufacturing has 8 accounts and Food & Beverage has 4. `Food & Beverage` stays one label: Words uses whole field values rather than splitting a sentence into words.
{% endstep %}
{% endstepper %}

<details>

<summary>Use several word fields or control font sizes</summary>

| You want                   | Configure this                                                                                                                              |
| -------------------------- | ------------------------------------------------------------------------------------------------------------------------------------------- |
| Labels from several fields | Add one Words entry per field. Identical values across fields are merged, so only combine fields that should contribute to the same labels. |
| A mix of label directions  | Set Word Orientation to Horizontal and Vertical.                                                                                            |
| Automatic sizing           | Leave Fit All Words on to try fitting the labels automatically.                                                                             |
| Your own font limits       | Turn Fit All Words off, then set Word Cloud Min Font Size and Word Cloud Max Font Size. Labels that cannot fit are omitted.                 |

If labels are missing, first check that their field values are not blank or `-`, and that their calculated **Word Size** is greater than zero. Those labels are excluded before placement. For eligible labels that do not fit, increase **Style > Size > Height**, reduce the manual font limits, or turn **Fit All Words** back on. Automatic fitting can still omit labels when space is too limited.

</details>

<details>

<summary>Sample data behind the map and Word Cloud captures</summary>

The captures use sample Account records created for this guide, with full province names and populated Industry values.

| Province         | Accounts | Industry        | Accounts |
| ---------------- | -------- | --------------- | -------- |
| Ontario          | 8        | Manufacturing   | 8        |
| Québec           | 4        | Food & Beverage | 4        |
| British Columbia | 3        | Technology      | 3        |
| Alberta          | 2        | Transportation  | 2        |
| Manitoba         | 2        | Consulting      | 2        |
| Nova Scotia      | 1        | Retail          | 1        |

These are two separate groupings of the same 20 accounts. The table does not pair a province with an industry. Use your own records; expected totals will differ.

</details>

## Troubleshooting Common Issues

| What you see                           | What to check                                                                                                                                                                                              |
| -------------------------------------- | ---------------------------------------------------------------------------------------------------------------------------------------------------------------------------------------------------------- |
| Blank chart or No Data                 | Check that the query returns records with the mapped fields populated. For Variable, check that the selected variable contains records.                                                                    |
| A total or average is unexpected       | Check the query filter, grouping field and Measures. Review Treat Blank Value As Zero for records with a missing measured value.                                                                           |
| Monthly values combine different years | Change the date grouping from Month to Year-Month.                                                                                                                                                         |
| Combo series all look alike            | Open each Y-Axis entry and check its Display As setting.                                                                                                                                                   |
| Palette changes have no effect         | Clear Custom Palette if you want to use a preset. A valid custom list has priority.                                                                                                                        |
| Every series has the same custom color | Add more colors. A one-color list repeats that color for every series.                                                                                                                                     |
| A color follows the wrong label        | Check the actual series or slice order. Custom Palette is positional; legend Item Order does not recolor the chart.                                                                                        |
| Gauge is pinned at the maximum         | Check Range Values and any range queries. A currency total is unlikely to fit the default maximum of 100.                                                                                                  |
| Map shows a message instead of a map   | For Country or Continent, check the names in Map > Regions. For Custom, check the file type, trusted URL and feature-name property.                                                                        |
| Some map regions are empty             | Check Region > Type and the mapped field. Match full names and accents to Map Separations (for example Québec, not Quebec on the Canada map), or check the latitude and longitude fields for Geo Location. |
| Word Cloud leaves out labels           | Check for blank or `-` labels and a zero or negative Word Size first: these are excluded. Then try Fit All Words, a taller chart or smaller manual font sizes. Automatic fitting can still omit labels.    |
| Donut groups disappear into Others     | Review Combine Small Groups into "Others".                                                                                                                                                                 |
| Legend takes up too much space         | Try a Top or Bottom position or enlarge the chart container. Reverse Item Order changes reading order, not the space needed.                                                                               |


---

# Agent Instructions
This documentation is published with GitBook. GitBook is the documentation platform designed so that both humans and AI agents can read, navigate, and reason over technical content effectively. Learn more at gitbook.com.

## Querying This Documentation
If you need additional information that is not directly available in this page, you can query the documentation by asking a question.

Perform an HTTP GET request on the following URL with the `ask` and `goal` query parameters:

```
GET https://docs.avonnicomponents.com/dynamic-components/components/chart.md?ask=<question>&goal=<user_goal>
```

`ask` is the immediate question: it should be specific, self-contained, and written in natural language.
`goal` is what the user is ultimately trying to achieve, the reason they need the answer. Sharing it helps GitBook give you a better, more relevant answer. A goal is most helpful when it describes the outcome the user wants rather than restating the question. For example, with `ask=how do I create an API token`, a goal like `automate deployments from our CI pipeline` lets GitBook tailor the answer to that use case.

The response will contain a direct answer to the question and relevant excerpts and sources from the documentation.

Use this mechanism when the answer is not explicitly present in the current page, you need clarification or additional context, or you want to retrieve related documentation sections.